Meridian Climate: making council emissions data impossible to ignore
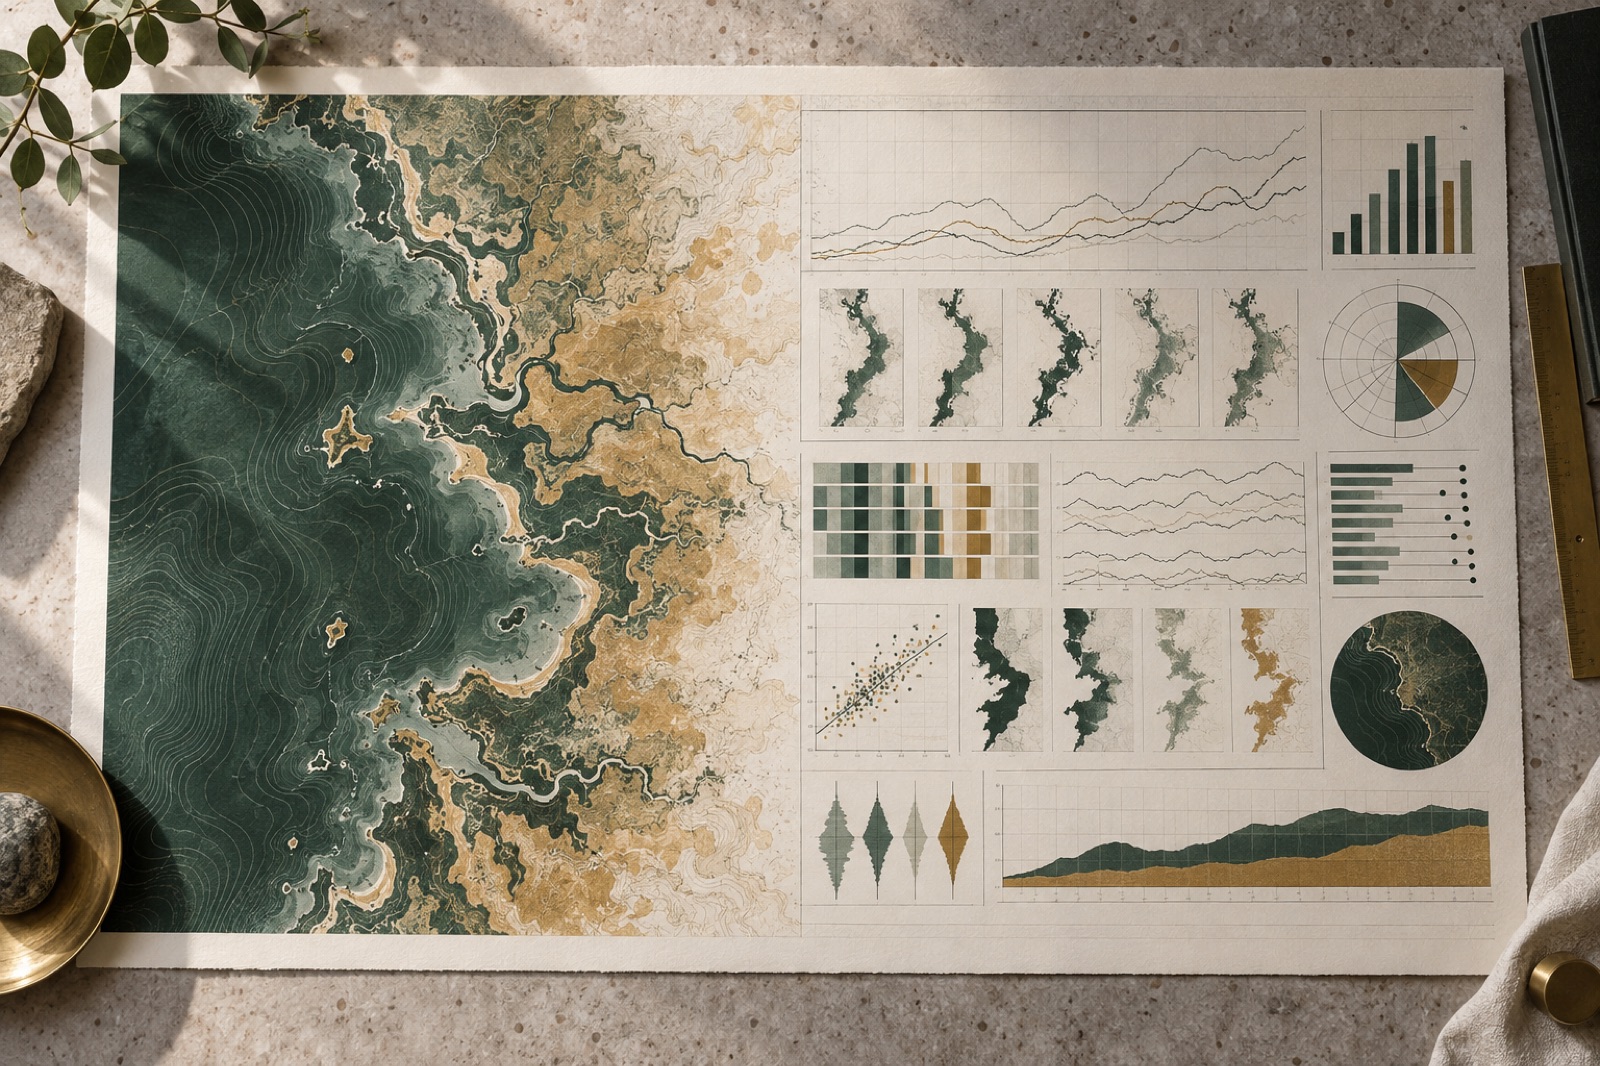
This case study ships with a working mini-product — mocked data, real craft.
Meridian Climate is a fictional-but-plausible non-profit that aggregates public emissions data across Australian local government areas. When they came to us, their product was a 14-tab Excel workbook, a PDF annual report, and a mailing list of councillors, journalists and residents who mostly didn't open either. The data was good. The data was also, functionally, invisible.
Their brief to us was one sentence: "Make it impossible to look away." Here is how we tried, what we refused to do, and what happened. As with every Brassfern case study, the figures are illustrative of the shape of the result, not a promise of yours.
The challenge
Climate data has a peculiar communication problem: the people who publish it optimise for defensibility, and the people who need it optimise for meaning. The gap between the two is where public attention goes to die.
Meridian's core asset was a dataset of scope 1 and 2 emissions for 537 local government areas, five sectors deep, eleven years long. Their core liability was the way it reached people: charts that started the y-axis wherever the spreadsheet defaulted, red-green colour ramps that excluded one in twelve men, and a report whose most-quoted statistic was wrong because two tabs disagreed.
We also faced an editorial-ethics challenge that most studios would politely ignore. Ranking councils by emissions punishes rural LGAs with big agricultural footprints and rewards dense urban councils that have effectively outsourced their emissions elsewhere. A naive league table would go viral and be misleading, which is the exact trade-off a climate platform must refuse to make.
And a technical one: residents open links from Facebook on four-year-old Android phones over regional 4G. Whatever we built had to run beautifully there. Rich interactive data stories usually don't.
The approach
One explorer, three doors. We designed a single scrollytelling explorer with three entry points matched to the three audiences we found in interviews: Your council (residents — type your suburb, get your LGA's story), The state of play (journalists — sector trends, ready-made embeddable charts with citations), and The deck (councillors — a mercilessly simple five-screen narrative that runs offline). Same data, same engine, three levels of patience. Designing for patience levels rather than personas is a trick we've carried into other work, including our education onboarding for Brightmarsh.
Scrollytelling that earns every scroll. The story is told in eight chapters, each making one claim, each claim anchored to one chart that enters in its final readable state and then changes exactly one thing per step — a filter, a comparison line, a time window. No gratuitous camera swoops; motion encodes meaning or it doesn't ship. The full story respects prefers-reduced-motion, degrading to a static chaptered article with identical content, because accessibility is not a fallback experience.
Comparison without a league table. Our answer to the ranking problem: every council is shown against a peer cohort — matched on population density and economic base — never against the nation as a whole. You see how Wollondilly compares to councils like Wollondilly, with the methodology one click away and written in plain English. Percentages first, absolutes second, per-capita always available. We wrote the ethics of the presentation into a public "how we show data" page and linked it from every chart footnote. Trust became a feature.
Colour, responsibly. We built a custom categorical palette tested against all three common colour-vision deficiencies, and — the part we're proudest of — we banned red as a synonym for bad. Emissions reductions can come from deindustrialisation, which is not a victory. The palette encodes quantity, not judgement; judgement is the reader's job.
Performance as editorial reach. All 537 LGA profiles are pre-computed to columnar files served from R2; the heavy lifting happens in DuckDB-WASM on the client, so the explorer is a static site with zero API bills and, more importantly, zero API latency. Charts render on canvas with a DOM fallback and we virtualise the story steps so total scroll memory stays flat. The numbers that mattered: 1.4s to first meaningful chart on a 2019 mid-range Android over regional 4G, and a 78/100 average Lighthouse score on devices we borrowed from a mates-and-family device lab rather than trusting the MacBook Pro.
The outcome
Six months after launch:
- Median time on the explorer: 6 minutes 40 seconds, against a 51-second average on the old PDF's landing page. People read eight-chapter stories; they skim fourteen-tab spreadsheets.
- 41% of sessions entered through "Your council" — the door we nearly cut for scope. Personal relevance beat comprehensiveness, exactly as JTBD interviews predicted.
- 89 embeds of Meridian charts in news stories and council papers in the first half-year, each carrying the citation line back to the explorer. Embeds became the organic distribution channel — a pattern we've seen elsewhere in our work.
- Three state-funded programs cited Meridian cohort analyses in their grant criteria within the year — the platform's intended outcome, and the one number Meridian's board actually cares about.
- Zero accuracy corrections since launch, down from "a few per report". One source of truth, pre-computed, is also one surface for error.
The ethics work paid off in an unexpected way: two councils that would have ranked "badly" on a naive league table became Meridian's most active contributors of finer-grained data, because cohort comparison gave their sustainability teams a story they could present internally without being ambushed.
Stack and team
React and TypeScript, D3 for charts rendered to canvas, MapLibre for the national map, DuckDB-WASM for client-side queries over Parquet files on Cloudflare R2. The whole thing is a static build — no servers to patch, no database to leak, no costs that scale with success. Team: one data visualisation lead, one engineer, one editorial designer, plus Meridian's data scientist embedded in our squad for the full twelve weeks, in line with how we run engagements.
What we'd tell another data organisation
Decide what you will refuse to publish before you design anything — the constraints were the design. Precompute everything you can; static is a feature, not a compromise. And write your methodology in the same voice as your story. Readers can smell a buried caveat.
Meridian's explorer is the kind of thing we love arguing about. See how we think on our journal, explore more case studies, or brief us on something important.
“The rare agency that treats your budget like their own money. Fixed scope, no surprises, and the numbers afterwards were real.”

Brightline Solar: from PDF quote form to 40-second estimate
How we replaced a solar installer's PDF quote form with a 40-second estimate engine — lifting qualified leads 71% and cutting cost per lead by a third.

Verdigris Archive: 80,000 botanical plates, searchable in a blink
A botanical museum put 80,000 plates online with fast faceted search, a deep-zoom viewer and public-domain downloads. Search success rose 63%.

Tidal Games: a storefront that outlasted launch day
An indie game label needed a store that could survive launch day and still feel hand-made. We built headless commerce and fair, queue-free drops.