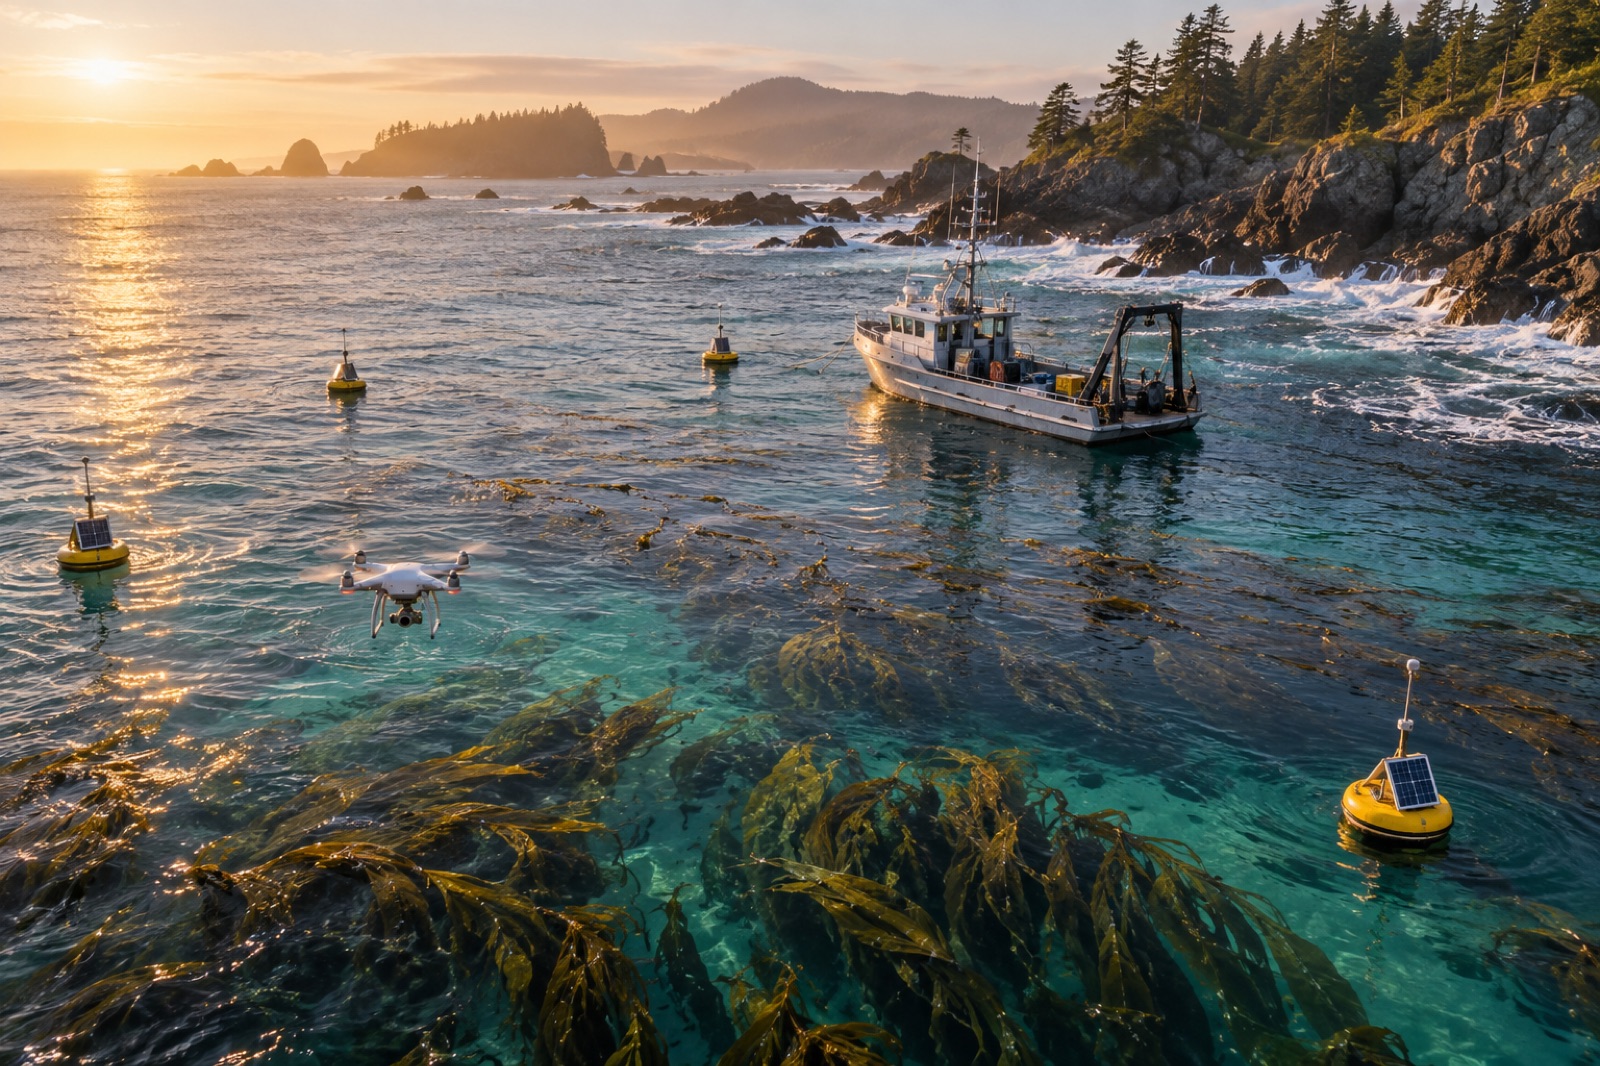
Ask a blue carbon developer where the money goes and most point at planting, permits and boats. Ask a blue carbon accountant and you'll hear a quieter truth: for a credit-issuing project, monitoring, reporting and verification is a permanent line of business, not a start-up cost. A mangrove project's MRV does not end at issuance — it recurs at every verification cycle, often for decades. Kelp projects face the same arithmetic, with the added twist that the thing being measured ignores fences, hides under waves, and changes every year. This piece walks through where MRV budgets actually go, line by line, what drives each line up or down, and what design choices made on day one decide the cost of proof for twenty years.
The conceptual frame for what MRV is — measurement, reporting, verification as three separate disciplines — is our overview, MRV explained; what follows is the invoice.
The anatomy of an MRV budget
Every blue-carbon MRV budget has the same skeleton, whatever the ecosystem. The proportions differ; the lines do not.
1. Baseline establishment
Before a credit exists, someone must answer "what was here before the project?" For kelp that means a pre-project survey campaign: canopy extent and biomass, sediment carbon where the methodology counts it, control sites to track the counterfactual, and the social baseline the safeguard sections will be measured against — the number every kelp carbon project starts from, as we put it in our piece on baselines. This is a front-loaded, survey-intensive cost: vessels, divers or ROVs, remote-sensing acquisition and processing, and lab work. It is also the line where decisions echo: an ambitious baseline with many strata and tight error bars costs more now and buys cheaper, cleaner verification cycles later.
2. Field monitoring campaigns
The recurring heart of "M". For a kelp project a typical measurement cycle includes:
- Canopy and biomass surveys — increasingly satellite-plus-drone for extent, with dive or sonar transects to convert extent to biomass.
- Sediment carbon coring where the methodology credits burial — cores, sectioning, bulk density and carbon analysis per layer.
- Water-column and export measurements where the methodology credits detrital export — traps, drifters, biomarkers, isotope work.
- Control/reference-site surveys — the plot that tells you what the coast would have done unprojected.
Each of these has the cost structure of oceanographic fieldwork: day rates on vessels, weather days, dive-team safety margins, lab throughput. Field campaigns balloon fastest with remoteness (a site two hours from a harbour is a different budget from one twenty minutes from a pier), with depth, and with storm-window risk — a budget that assumes every scheduled day is workable is a fantasy budget.
3. Laboratory analysis
Bulk density, loss-on-ignition or elemental carbon, stable isotopes, biomarkers, eDNA — each costs per sample, and sample numbers multiply faster than project planners expect. A modest grid of sediment cores across sites, depths and seasons becomes hundreds of analytical invoices. This is where sampling design is a financial instrument: the difference between a statistically defensible minimum and a comforting over-sample can be a quarter of the lab budget, every cycle. Our walk-through of field sampling for kelp carbon is where plot design meets this invoice.
4. Data management and reporting
The least-photographed line — and one of the largest. Carbon data must be ingested, quality-controlled, stored in auditable form, transformed into carbon accounts per the methodology, written up into monitoring reports, and archived so that an auditor years later can trace every number to an instrument on a day. Projects underestimate this at their peril: staffing skilled analysts and building the reporting pipeline are labour costs that recur at every cycle, and they scale with the complexity of the chosen methodology more than with the size of the forest. A project using canopy extent alone reports cheaply; a project claiming sediment, biomass and export pathways reports three times — and pays three times.
5. Third-party verification and audit
The "V" is bought on the open market from accredited validation and verification bodies. Their invoices are scoped by project complexity, site count, methodology complexity and the auditor's day-rates, and they arrive at every issuance cycle. Verification is also where schedule risk lives: an audit finding that requires a supplementary field season is the single most expensive event in an MRV budget because it couples professional fees to a second vessel charter. Our guide to what auditors actually check shows how to make this line boring — which is the goal.
6. Registry and issuance fees
Registries charge for account maintenance, credit issuance, and per-credit retirement transfers. These are honest line items — small against field costs, but count them: they scale per credit and per cycle, and a project that issues often will notice them.
7. Buffer-pool contributions and risk instruments
Not strictly MRV, but verified projects pay into buffer pools against reversal risk, and an increasing number pair those with insurance. Think of these as the cost of standing behind the claim — our tour of buffer pools and permanence sets out the logic that prices them.
What design choices move the bill
Two projects with identical forests can have MRV budgets that differ severalfold. The levers:
- Methodology ambition. Claiming only canopy-biomass carbon is cheap to measure; claiming sediment and export pathways is expensive every cycle. Choose claims to fit the site's monitoring reality, not its theoretical carbon.
- Zoning and stratification. Fine stratification improves precision but multiplies plots, cores, dives and lab samples. Coarser strata with more replicates per stratum often win the cost-precision trade.
- Remote-sensing architecture. A project designed to let satellites and drones do the extent-mapping, with fieldwork reserved for calibration, spends its vessel days where they're decisive. This is exactly the architecture behind Tidewright's Canopy Ledger, built to push care onto the cheapest sensor that will carry the claim.
- Aggregation. Multiple small sites sharing one vessel mobilisation, one lab batch and one audit spread the fixed costs that dominate small projects — the rationale of project developers' pooling models.
- Data plumbing built early. A well-designed data pipeline is boring software and a cheap audit. Bolted-on pipelines are how supplementary field seasons get bought.
An illustrative picture
Exact MRV costs are site-specific, commercially sensitive and methodology-dependent, but the shape of a budget is stable enough to sketch. The following split is an illustrative composite — Tidewright's share-out of a mid-scale kelp-restoration MRV cycle, shown to convey structure, not as an industry quote:
| Budget line |
Indicative share of cycle spend |
| Field campaigns (vessels, dive teams, sensors) |
35–45% |
| Laboratory analysis |
15–20% |
| Data management and reporting |
12–18% |
| Third-party verification and audit |
10–15% |
| Remote-sensing acquisition and processing |
8–12% |
| Registry, issuance and buffer instruments |
3–8% |
The lesson of the shape: MRV is a fieldwork and labour budget, with technology as the pressure valve. The sensor revolution driving down the cost of MRV across the sector pushes at exactly the two largest lines at once — field days and lab samples — and it is why the honest cost of proof on the ocean keeps falling.
Key takeaways
- MRV is a recurring cost of being a credit-issuing project, not a one-off: field campaigns, lab work, reporting, audits and fees recur at every verification cycle for decades.
- The biggest lines are vessels/dive teams and laboratory analysis; the most under-budgeted line is data management and reporting.
- Remoteness, depth, storm risk and methodology ambition are the four levers that move a budget severalfold between otherwise similar projects.
- Designing cheap MRV on day one — sensible stratification, remote-sensing architecture, shared audits, early data plumbing — is the difference between a bankable credit and a grant-dependent one.
- Falling sensor costs are compressing the fieldwork share of MRV, which is the structural positive behind ocean carbon's long-term economics.
FAQ
Is MRV a one-time cost?
No — it recurs at every monitoring and verification cycle over a project's crediting life, which can run 20–40 years. Only baseline establishment is front-loaded; the rest is a standing operational cost the project's carbon revenue must carry.
What is the most expensive single part of blue-carbon MRV?
Usually field campaigns: vessel days, dive-team logistics, and weather delays come at ocean-going prices. Laboratory analysis follows, because sample numbers multiply with strata, depths and seasons faster than planners expect.
Can satellites replace fieldwork?
No — they replace the extent side of fieldwork. Satellites and drones now map canopy cheaply, but biomass calibration, sediment carbon and many control-site questions still need boats, divers and cores. The sensor revolution shrinks the field budget; it doesn't dissolve it.
How do developers lower their MRV bill?
Choose a methodology whose claims match the site's measurability; stratify coarsely and replicate; design architecture so remote sensing does extent work; pool sites to share vessels and audits; and build data pipelines before the first survey, not after.
Why does MRV cost matter for buyers?
Because a project's MRV economics are its integrity economics. A credit priced below its monitoring cost is either subsidised, or monitored thinly. Cheap, durable, well-paid-for proof is the foundation the claim stands on.