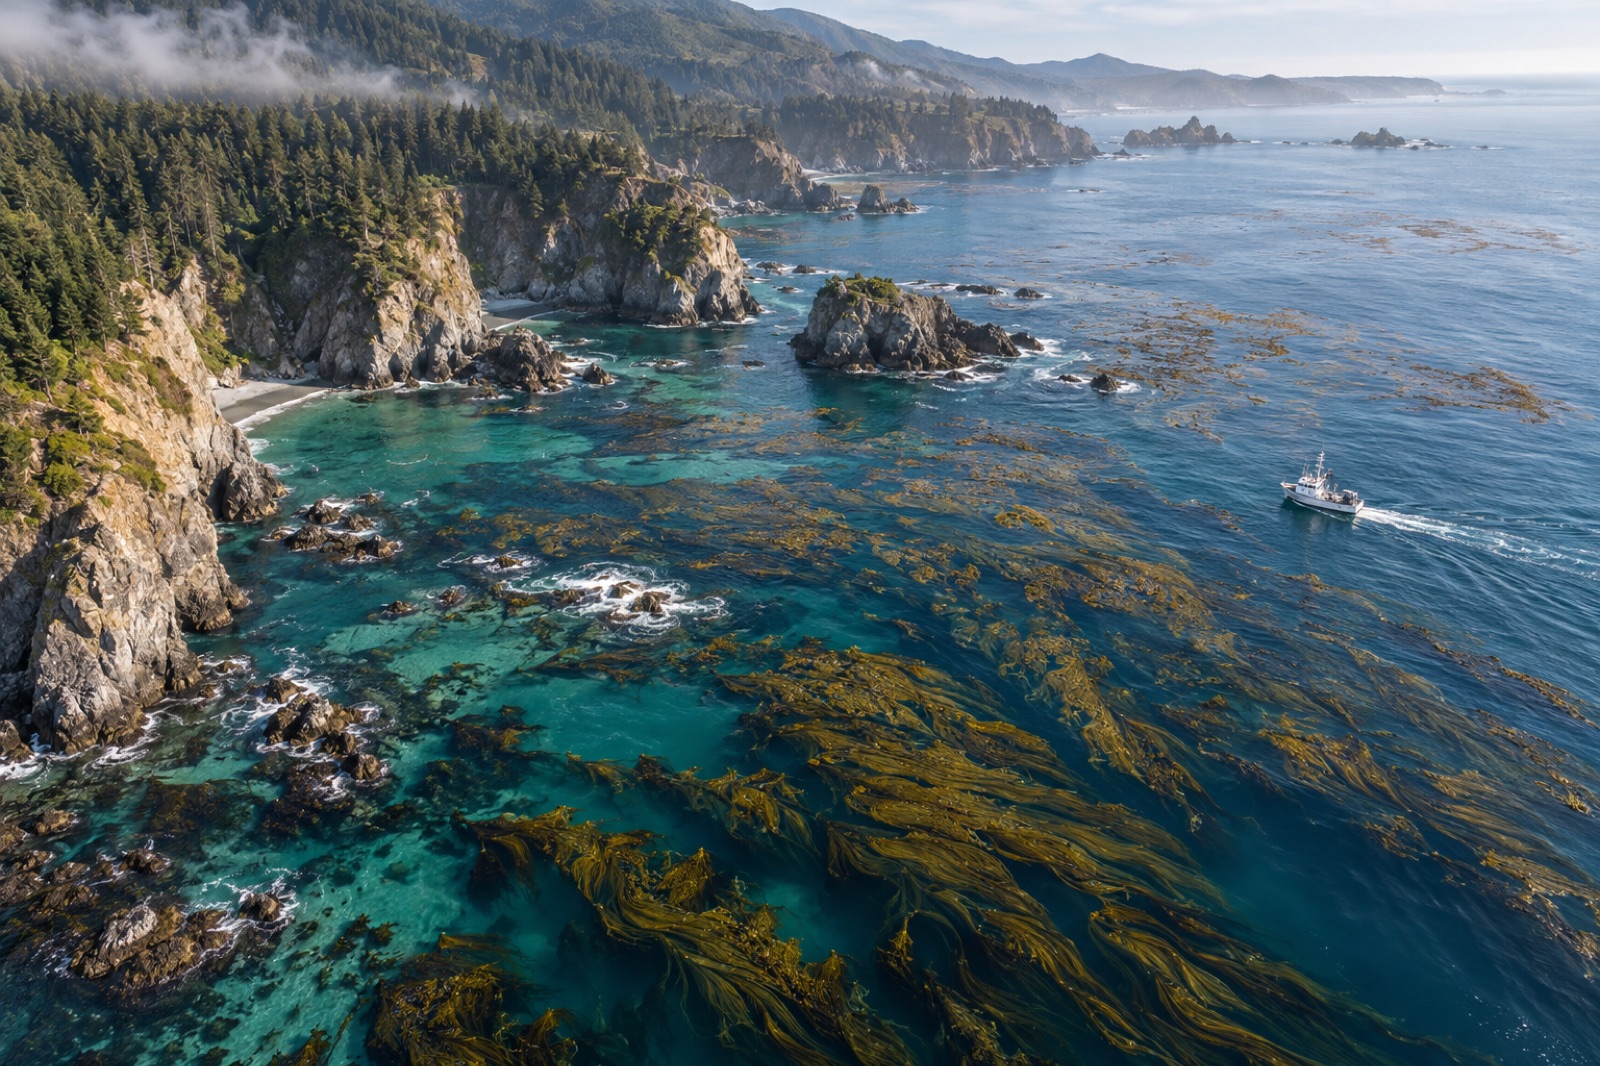
Every credible kelp carbon claim ultimately rests on somebody in a drysuit, in cold green water, counting plants inside a quadrat. Satellites map the canopy and sonar profiles the reef, but the conversion from "there is a canopy" to "there are this many tonnes of carbon, within this uncertainty" passes through field sampling — and the quality of that sampling determines whether the numbers survive audit. This guide is for project developers, marine scientists, and curious buyers who want to understand what good underwater field design looks like: how plots are laid out, why replicates are chosen the way they are, how stratification saves money, and why honest error bars are a feature, not a confession. It sits within the bigger measurement framework of MRV for blue carbon and the operational stack of measuring kelp carbon at sea.
What the field program actually has to estimate
A kelp carbon project needs three field-derived quantities, each with different sampling requirements:
- Floral biomass density — kilograms of kelp (wet or dry) per unit area, usually from diver or drop-camera surveys, converted to carbon using tissue carbon content measured in the lab.
- Sediment carbon — organic carbon stocks in reef-adjacent sediments, from cores or grabs (the dedicated guide is sediment core sampling explained).
- The reference condition — the same quantities at control sites or before intervention, because a credit is always a difference: project minus baseline (see setting a baseline).
The design challenge is that all three quantities are patchy. Kelp density varies by an order of magnitude over tens of metres with depth, exposure and substrate; sediment carbon is even clumpier. Sampling design exists to convert patchiness you can't eliminate into uncertainty you can quantify.
Plots, quadrats and transects: the basic geometry
Underwater ecology uses three classic sample units, and kelp carbon work uses all three:
- Fixed plots. Permanently marked areas (often 25–100 m²) revisited each season. Fixed plots are the gold standard for detecting change over time, because revisiting the same rocks removes spatial variation from the temporal comparison. Their weakness: a handful of plots can't describe a whole reef.
- Belt transects. A tape (typically 20–50 m) laid across the reef, with kelp counted or measured in a strip of known width on either side. Transects are efficient in surge and limited visibility, and they capture depth gradients when run perpendicular to shore.
- Quadrats. Portable frames (0.25–1 m²) used for high-resolution counts, destructive biomass harvests for allometric equations, and sediment grabs. Quadrat harvests are where biomass-per-thallus equations are built — the equations that let later, non-destructive surveys estimate biomass from canopy measurements.
Good programs combine them: permanent plots anchor the time series, randomized transects provide spatial coverage, and quadrat harvests keep the allometry honest. This layered structure is exactly how our (fictional, illustrative) field teams work on Tidewright restoration sites — see the projects pages for how monitoring integrates with restoration, and the impact methodology page for how the numbers flow into reporting.
The statistics nobody can skip
Sampling error vs. everything else
Replicates exist to estimate sampling error — the spread you get because you sampled some patches and not others. But total error also includes measurement error (diver counts vs. reality, lab instrument precision) and model error (allometric equations fitted on 200 plants, applied to millions). Field design can only control the first; honest reporting accounts for all three. The treatment of layered uncertainty in crediting is explored in uncertainty in carbon accounting.
How many replicates? The pilot-study answer
There is no magic number, because the right replicate count depends on the variability of your reef and the effect size you need to detect. The professional route is a pilot season: one round of 20–30 preliminary samples, from which you compute variance, then run a statistical power analysis — "how many plots do I need to detect a 50% increase in biomass with 80% confidence?" Patchy systems routinely reveal that 8 plots per site detect almost nothing while 30 per site detects plenty. Skipping the pilot and guessing replicate counts is the single most common design failure in first-generation blue carbon field programs.
Independence of replicates
Ten quadrats crowded along one transect are not ten independent samples — they are ten measurements of one patch of reef. True replicates must be spread across the site (or the stratum), ideally with randomized locations. Pseudoreplication — treating non-independent samples as independent — understates error bars and inflates confidence, and it is a classic target for verification auditors (what auditors check).
Stratification: design that buys precision cheaply
Kelp reefs are not uniform, so don't sample them as if they were. Stratified sampling divides the site into zones expected to differ — by depth band, wave exposure, substrate type, or restoration age — and allocates samples within each. Stratification pays twice:
- It reduces the variance within strata, shrinking error bars for the same field effort.
- It prevents the classic blunder of samplers unconsciously favoring easy, shallow, sheltered water — a bias that systematically overestimates recovery, since sheltered shallows recover fastest.
Modern practice uses remote sensing — canopy maps and sonar bathymetry — to draw stratum boundaries objectively before the first dive, then places randomized sampling points within each stratum using GIS. On our sites, stratification plus remote sensing typically cuts required dive effort by a third to a half for the same statistical confidence (illustrative figures) — money that can go to more sediment cores or community monitoring jobs instead.
Controls, references and the BACI design
The baseline is not a guess — it is measured. The strongest restoration designs follow BACI logic (Before–After–Control–Impact): sample the impact site and one or more comparable control sites, before and after intervention. A restored reef whose kelp returns while adjacent control reefs also recover naturally proves less than one whose kelp returns while controls stay barren. Controls also absorb the confounding influence of regional climate years — a good upwelling year lifts all sites, and only paired controls separate that from the restoration effect.
Choosing controls is an art: they must match the project site in depth, exposure, substrate and history, yet be independent of its influence. Two mediocre controls are worse than one excellent one. Where true controls don't exist, credible alternatives include reference-condition models from historical data and synthetic controls built from regional monitoring — approaches that must be declared, not hidden.
From counts to carbon: the conversion chain and its compounding errors
Field numbers become carbon numbers through a chain, and uncertainty compounds at each link:
Count/area → biomass via allometric equations (error 1).
Fresh biomass → dry biomass via subsample drying ratios (error 2).
Dry biomass → carbon via tissue carbon fraction measured by elemental analysis (error 3 — and yes, it varies by species, tissue type and season; stipe, blade and holdfast differ).
Point estimates → site totals via area scaling against habitat maps (error 4 — map classification accuracy).
A credible protocol measures each conversion empirically for its own region, propagates all four errors through to the final estimate, and reports the result as a mean plus an interval. Program designs that report a single number with no stated uncertainty should not pass verification; buyers should ask for the uncertainty statement before asking for anything else, as set out in our due diligence checklist.
Safety, seasonality and logistics — the field realities
Three practical constraints shape design more than statistics do:
- Diver safety and bottom time. Cold, surgy water limits productive sampling to a handful of hours per diver per day. Designs must be executable within real budgets of time and gas — which is a strong argument for cameras and drop-down imagery on deep or exposed strata, reserving divers for work only humans can do.
- Seasonality. Canopy biomass on temperate kelps peaks and crashes through the year; compare only like with like (same season, ideally same month). A single misplaced season can masquerade as a year of recovery.
- Weather windows. Field programs need contingency design: priority-ordered stations so that a blown-out fortnight drops the least informative samples rather than the most reachable ones.
These realities are why field design is best written by people who dive the sites, reviewed by people who do the statistics, and audited by people who do neither — three perspectives, one protocol.
What a verification-ready field program looks like
When a project reaches audit (inside a verification audit), the field program survives scrutiny if it has: a written sampling protocol with named strata and pre-registered station locations; raw datasheets and imagery archived and traceable; chain of custody for sediment and tissue samples; lab certificates for carbon analysis; a power analysis justifying replicate counts; and a declared uncertainty budget carrying through to the credit calculation with conservative deduction. Verifiers increasingly ask to see the pilot-study data that justified the design — a healthy development for the entire market.
Tidewright's field protocols (fictional, illustrative) publish station coordinates, visit dates and summary statistics alongside our claims, because in blue carbon the field book is the asset. Buyers of our credits should be able to read, at station level, where every tonne came from — and what its error bar is.
Key takeaways
- Kelp carbon claims rest on three field estimates — floral biomass, sediment carbon, and a measured reference condition — each demanding its own design.
- Combine permanent plots (change over time), randomized transects (spatial coverage) and quadrat harvests (allometry), stratified by depth, exposure and substrate using remote sensing.
- Run a pilot season and power analysis before fixing replicate counts; beware pseudoreplication — crowded quadrats are not independent samples.
- BACI designs with genuine control sites separate restoration effects from good ocean years.
- Report every estimate as a number plus an interval, with the full conversion-chain error budget — uncertainty stated honestly is what passes audit.
FAQ
How many sampling stations does a kelp carbon project need?
Enough to detect the expected effect with stated confidence — determined by a pilot-based power analysis, not a universal number. Patchy, high-energy reefs need more stations per stratum than uniform sheltered ones. Projects quoting station counts without variance data are quoting guesses.
Can cameras and AI replace divers?
Partly. Georeferenced imagery and machine-learning canopy classifiers now handle much of the spatial work, and their cost per station is far lower than dive time — this is the shift described in the MRV technology revolution. But destructive quadrat harvests for allometry, sediment coring and tissue chemistry still need hands in the water. The optimal program is hybrid.
What is the single biggest field-design mistake?
Sampling where it's easy. Convenience samples — sheltered, shallow, close to the boat ramp — systematically overstate recovery. Randomized station placement within strata, drawn in the office before anyone gets wet, is the antidote.
Why not just use satellite canopy area instead of field sampling?
Because canopy area is not carbon. The conversion from pixels to tonnes requires field-measured biomass density, tissue chemistry and sediment data. Satellites scale field truth across space; they don't replace it.
How often should a project re-sample?
Annually at minimum for biomass, with sediment re-sampled on the timescale the methodology specifies (often five-yearly). High temporal frequency matters most in early years, when baselines and trajectories are being established — and when design can still be corrected cheaply.