Giant kelp grows up to half a metre a day, lives in the surf zone, and shelters beneath a surface that scatters light in every direction. By any standard it is a difficult thing to measure. Yet we now possess an unbroken, four-decade record of kelp canopy along tens of thousands of kilometres of coastline — measured from space, at 30-metre resolution, entirely for free. Remote sensing has become the backbone of kelp monitoring, and increasingly the input layer for blue carbon accounting. This article explains how the sensors see kelp, what each platform can and cannot prove, and how a pixel of canopy becomes — cautiously — a number on a carbon ledger.
Why kelp is strangely well-suited to satellites
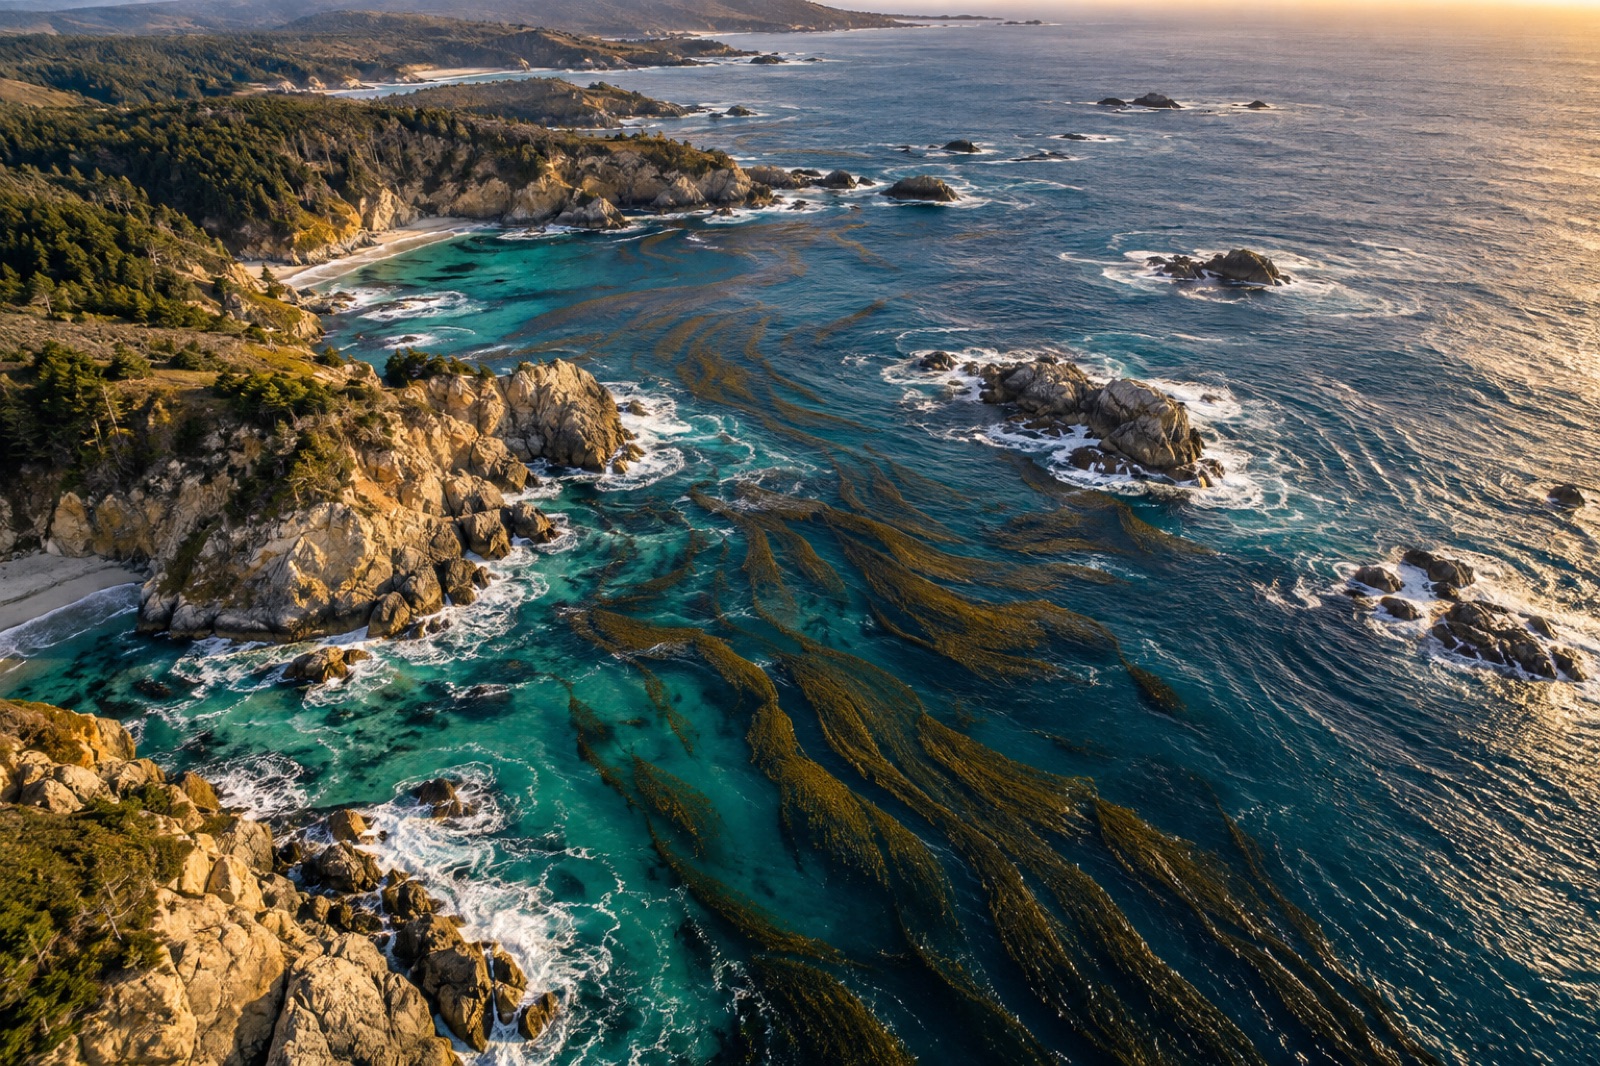
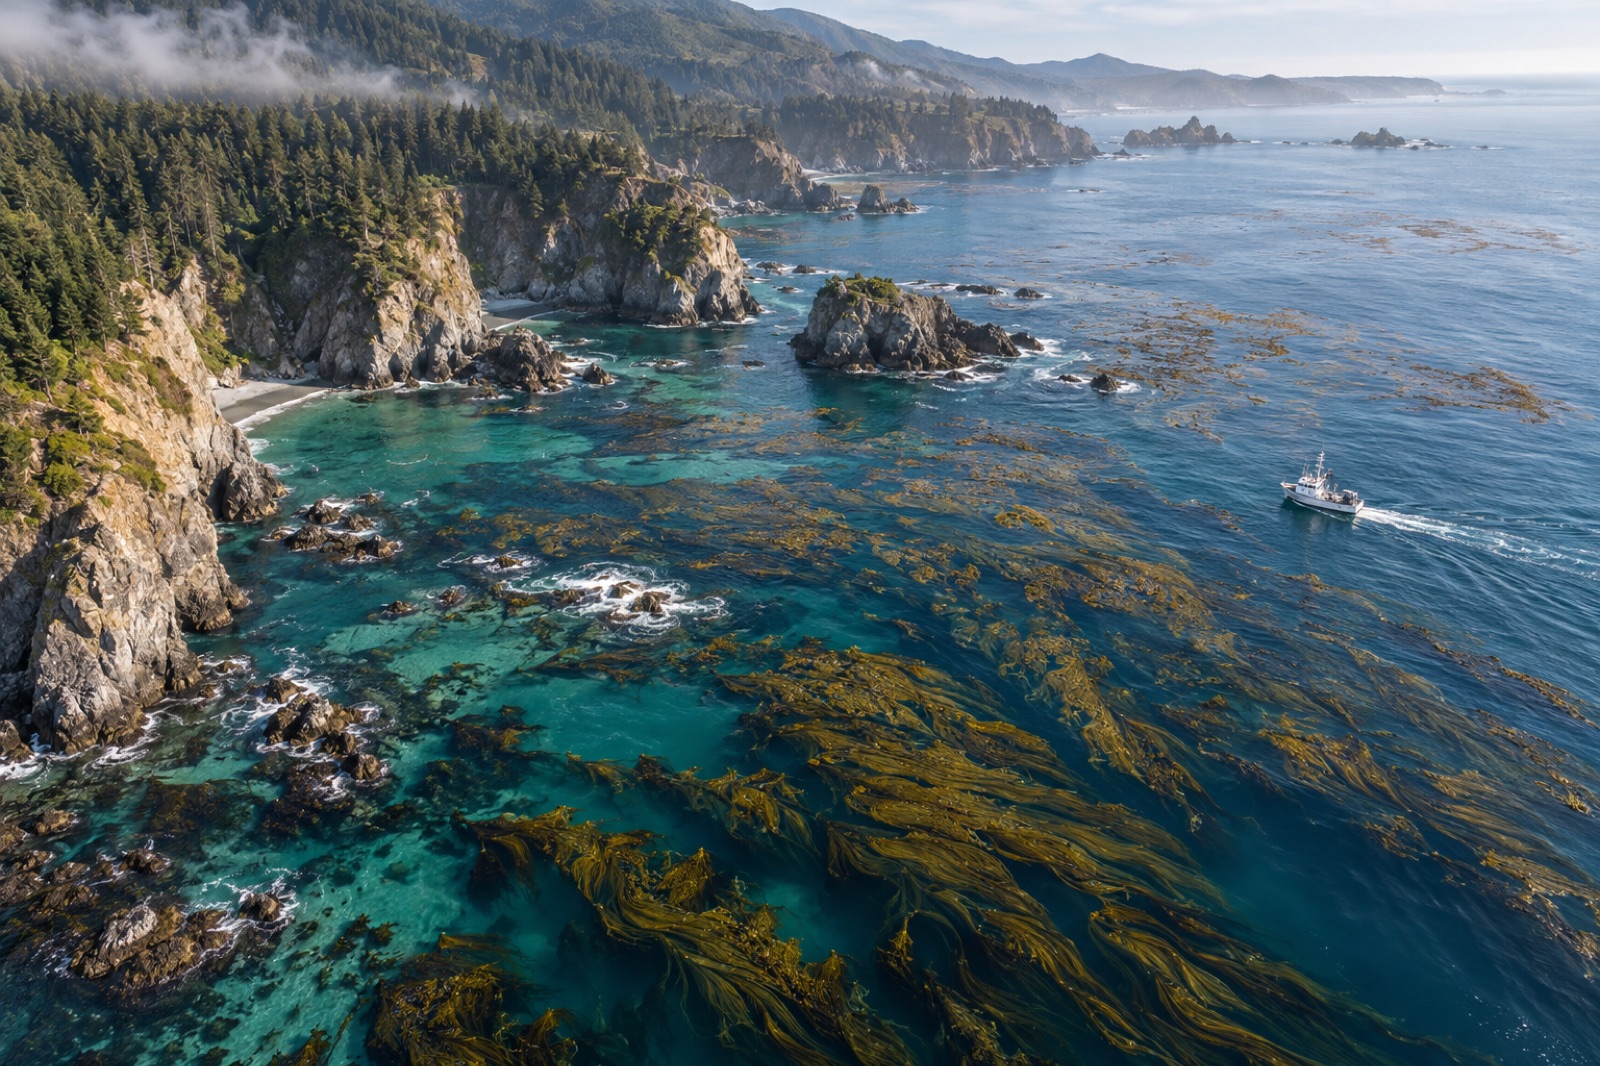
Most submerged vegetation is invisible from orbit. Kelp is the rare exception, for a structural reason: Macrocystis pyrifera, giant kelp, grows fronds that trail along the sea surface, and bull kelp rafts its blades up on gas-filled floats. A canopy-forming kelp effectively projects part of itself onto the one plane a satellite can see — the surface film of the ocean.
The spectral trick is water's transparency window. Liquid water absorbs infrared aggressively but transmits visible and near-visible light; kelp tissue, like any leaf, reflects strongly in the near-infrared and absorbs red for photosynthesis. A dense surface canopy therefore shows a vegetation-like signature floating on a dark, absorptive sea — a contrast that classic vegetation indices can exploit. Researchers demonstrated in the 1990s that Landsat's near-infrared band could map giant kelp canopy, and the Landsat archive — which reaches back to 1984 — has since been turned into continuous canopy time series for coasts from Baja California to Tasmania. Kyle Cavanaugh's work at the University of California pioneered much of this, including the discovery that even smaller kelps, and kelp beds detected from the faint wake of spectral signal below the surface, are mappable with careful processing.
The result is one of the great under-heralded datasets in marine science: where terrestrial ecologists argue about baseline shifts over decades, kelp scientists can replay forty years of canopy, pixel by pixel.
The sensor stack, from orbit to sea level
Landsat and Sentinel-2: the workhorses
Landsat (30 m pixels, sixteen-day revisit, archive back to 1984) and the European Sentinel-2 pair (10–20 m pixels, roughly five-day revisit since 2015) carry the monitoring burden. Both are free, global and consistent — the three properties that matter for trend analysis. Their limits are shared: 30 m means a Landsat pixel can mix canopy and open water (mixed-pixel methods now estimate fractional cover rather than a binary yes/no), and neither sees through cloud, which on temperate kelp coasts is a serious sampling bias.
Commercial high-resolution and SAR: filling the gaps
Three-metre commercial constellations image daily and resolve individual kelp beds and even gaps within a canopy — invaluable for siting restoration and checking outcomes. Synthetic aperture radar (SAR) satellites see through cloud and at night; while radar does not sense kelp pigments, it detects the way a floating canopy damps small surface waves, smoothing the sea surface. SAR-based canopy detection is an active research area and a promising all-weather complement.
Drones and aircraft: the calibration layer
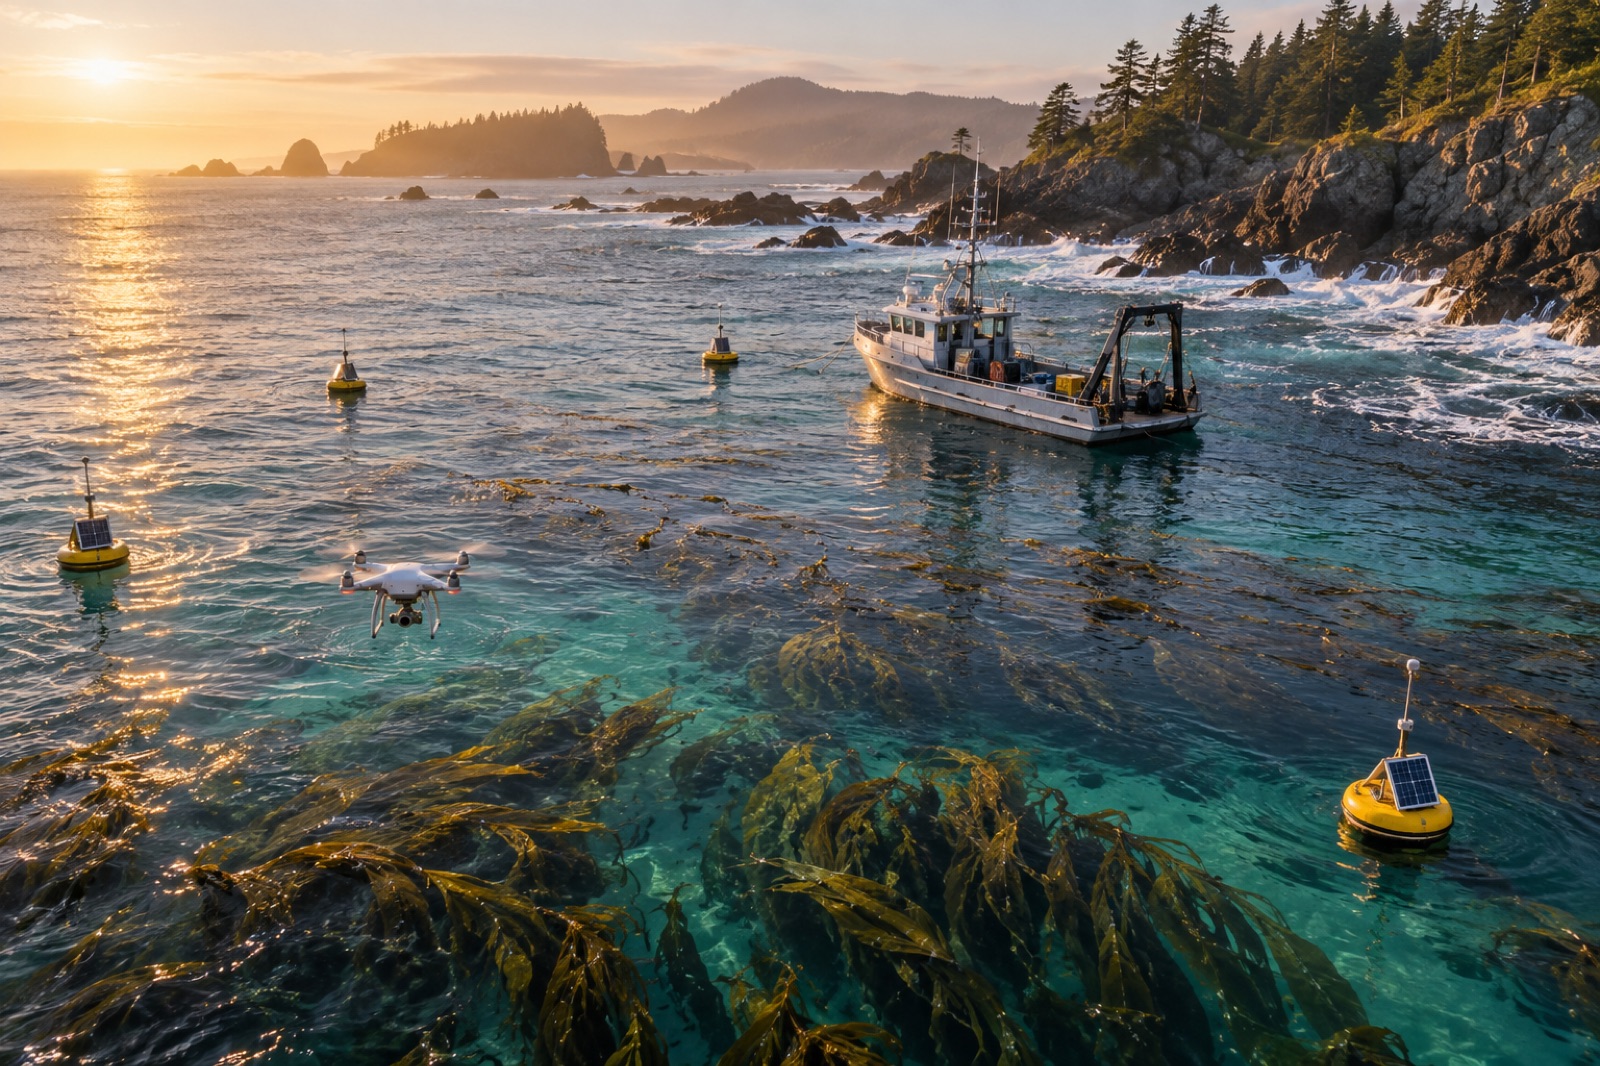
Multispectral drones map canopy at centimetre resolution, timing flights to tide and sun for clean water surface conditions. Their job in a monitoring program is not coverage — a drone will never survey a coastline — but calibration and validation: the fine-grained truth against which satellite classifications are trained and checked. A well-run program flies drones over a network of reference beds and lets the satellites do the wall-to-wall work.
In-water sensors: proving what lies beneath
No airborne sensor measures what happens below the surface canopy: stipe density, plant biomass per square metre, detrital export to sediment. That requires divers, sonar, drop cameras and sediment cores. The architecture of credible kelp carbon MRV is therefore always a stack — satellite for extent, drones for calibration, in-water sampling for the biomass-and-export numbers that carbon accounting actually needs. We walk through that full pipeline in measuring kelp carbon at sea, and the cost transformation this stack enables in the MRV technology revolution.
From canopy pixels to carbon numbers
Here is where discipline matters most, because the step from "canopy observed" to "tonnes sequestered" crosses three conversions, each with its own error bars.
- Pixel to area. A detection algorithm converts spectral signatures into canopy extent — or fractional cover. Errors here come from mixed pixels, sun glint, sunglint-corrected turbidity, and confusion with floating debris or phytoplankton blooms.
- Area to biomass. Canopy extent is translated into standing biomass using allometric relationships: field-measured biomass per unit canopy area. These relationships vary by site, season and condition — a canopy thinned by a marine heatwave photosynthesises and stores less per square metre than a dense spring canopy. Site-calibrated relationships from in-water surveys are what separate a monitoring program from a wall-poster map.
- Biomass to durable carbon. Standing kelp biomass is not sequestered carbon; most of it is eaten, decomposed or exported within a year. The creditable portion is the fraction exported to depths or sediments where it stays out of the atmosphere — the detrital pathways detailed in where kelp carbon actually ends up and how kelp stores carbon. Remote sensing informs the growth-and-loss side of the mass balance; tracers, sediment traps and modelling inform the fate side.
Honest methodologies report the full uncertainty chain and deduct it from the claim. A map with glossy colours and no uncertainty statement is marketing material, not MRV.
What remote sensing proves — and what it cannot
It proves extent and change, beautifully. Documenting that a restored reef carries canopy where none existed for a decade is a satellite-grade claim: cheap, repeatable, independently checkable by anyone with the same public imagery. This alone has transformed restoration accountability — before-and-after is no longer a matter of trusting the developer's divers.
It detects loss fast. Canopy collapse in a marine heatwave, storm stripping, or disappearance after a pollution event shows up within one or two clear-sky revisits. For permanence monitoring and reversal detection, that speed is what buffer pools and insurance products are built on.
It cannot prove fate. A satellite cannot watch a frond sink. Export to the deep sea — the pathway that matters most for durable kelp carbon — is inferred from biomarker tracers, sediment cores and oceanographic modelling, not pixels.
It cannot see below cloud, below turbidity, or below the canopy's own shade. Turbid temperate waters, subsurface kelps like Ecklonia forests that never raft to the surface, and winter conditions all degrade or defeat optical sensing. Program design has to specify what the sensor stack actually covers rather than implying wall-to-wall certainty.
The road ahead
Three trends will define the next decade of kelp remote sensing. First, hyperspectral sensors — measuring dozens of narrow bands instead of a handful — are opening species-level discrimination and water-column correction that broadband sensors cannot do. Second, machine learning is pushing detection into marginal conditions (thin canopy, partial pixels) that rule-based indices wrote off. Third, data fusion — combining optical satellites, SAR, drone surveys and moored sensors into single assimilated products — is converging on continuous, uncertainty-quantified canopy monitoring rather than occasional snapshots.
For carbon markets, the consequence is a narrowing of excuses. When canopy extent is independently observable by anyone with a laptop, claims about restoration success become checkable in the strongest sense — and both buyers and registries can insist on it. That direction of travel is good for the honest developers and fatal for the rest.
Where Tidewright fits
Tidewright is a fictional company, so read this as an illustration of the architecture rather than a product review: our fictional Canopy Ledger platform is imagined as exactly this stack — public satellite time series for extent, drone reference flights for calibration, vessel and diver surveys for the subsurface truth, and all of it feeding registry-grade reporting. The fictional impact dashboard shows what such a pipeline might surface. Real-world analogues across research groups and monitoring agencies are assembling precisely these capabilities — and that, fictional as our deployment is, is very good news for real kelp.
Key takeaways
- Kelp is uniquely satellite-visible among macroalgae because canopy-forming species float fronds at the surface, producing a vegetation-like spectral signature against dark water.
- Free Landsat and Sentinel-2 archives deliver multi-decade, wall-to-wall canopy records; commercial high-resolution and radar (SAR) fill the resolution and cloud gaps.
- Drones and in-water surveys are the calibration layer: satellites measure extent, but only fieldwork converts extent into biomass and only oceanography converts biomass into durable carbon.
- The canopy-to-credit chain has three conversions — pixel to area, area to biomass, biomass to durable carbon — each requiring its own uncertainty treatment.
- Remote sensing proves extent and change cheaply and detects loss fast; it cannot observe carbon's fate after export, which requires tracers, cores and models.
- Hyperspectral sensing, machine learning and multi-sensor fusion are converging on continuous, uncertainty-quantified kelp monitoring.
FAQ
Which satellite is best for monitoring kelp forests?
For long-term trend analysis, Landsat's 30 m record back to 1984 is unmatched. For current operational monitoring, Sentinel-2's 10–20 m pixels and five-day revisit offer better resolution and frequency, and both datasets are free. High-resolution commercial imagery is best for project siting and verification of small restored beds.
Can satellites measure how much carbon a kelp forest stores?
Not directly. Satellites measure canopy extent, which feeds the first step of a carbon model. Standing biomass requires field-calibrated allometry, and durable sequestration requires evidence about carbon export and burial — a distinction explained in our piece on honest kelp carbon accounting. Any "satellite-measured carbon" figure for kelp is a model output and should be labelled as such.
Does remote sensing work for all kelp species?
It works best for surface-canopy species like giant kelp and bull kelp. Subsurface forests — many Ecklonia and Laminaria systems — are detectable only in clear, shallow conditions, if at all, and usually require sonar or diver surveys instead.
How do cloudy coasts get monitored?
Through SAR (which images through cloud), by compositing optical imagery over longer windows, and by weighting drone and in-water surveys. Cape-to-coast programs on famously cloudy coasts treat cloud-free images as samples rather than a complete census.
Is the satellite data public?
Landsat and Sentinel-2 imagery is free to download, and several research groups publish processed kelp canopy layers openly. That public availability is a quiet revolution in accountability: any buyer, journalist or citizen can inspect the same canopy history a project claims credit for — a principle we explore in open data for ocean science.