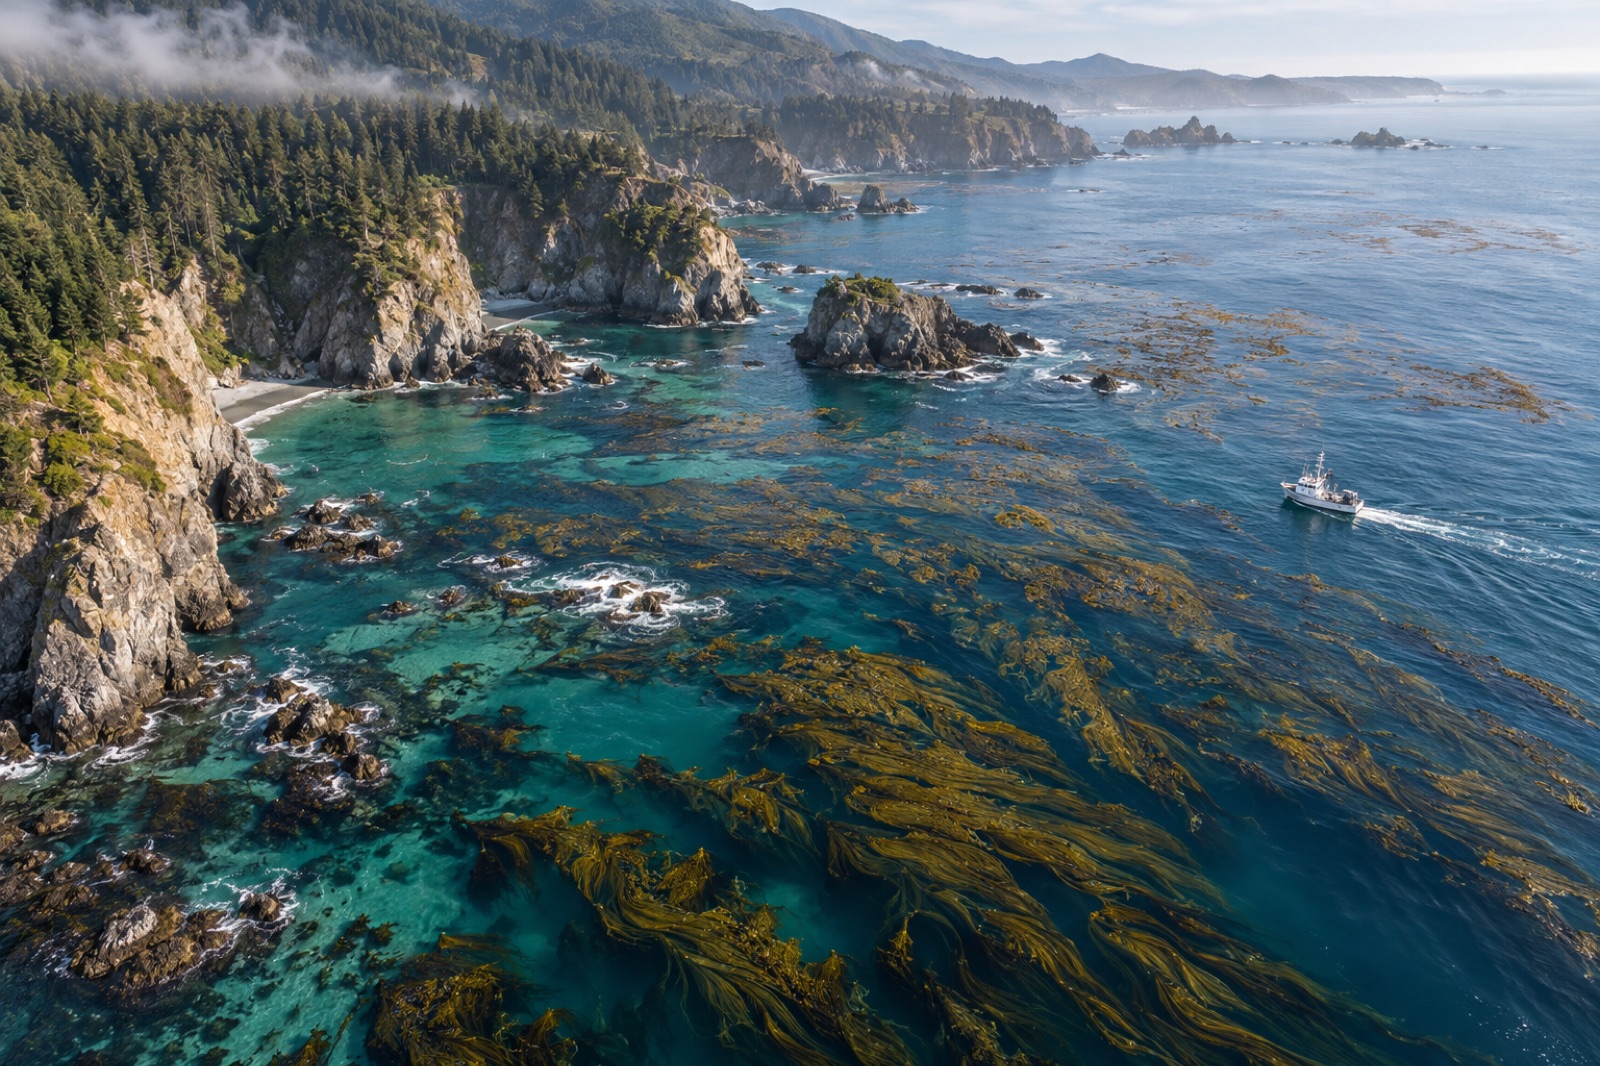
Turning a kelp forest into a verified carbon claim is a pipeline, and every stage in it can lose tonnes, gain phantom tonnes, or get rejected by an auditor. The general architecture of blue carbon MRV — baselines, boundaries, verification — is covered in our MRV overview. This piece follows the pipeline at sea level, step by step: how a canopy seen from orbit becomes a biomass estimate, how biomass becomes carbon, how carbon becomes a sequestered fraction, and how all of it survives an audit. It is fieldwork as much as finance, and the fieldwork is where credibility is made.
Step 1: Map the extent — eyes in orbit, drones overhead
The pipeline starts with a deceptively simple question: where is the kelp, and how much surface does it cover?
Satellites provide the synoptic view. Multispectral sensors can detect the distinctive near-infrared signal of floating kelp canopy — kelp's fronds reflect strongly in bands that water absorbs — and modern analysis pipelines flag canopy pixels over entire coastlines, month by month, year by year. The limits are real: canopy-forming species with subsurface canopies (the dominant habit of golden kelp and many Laminaria species) are poorly visible from orbit; sun glint, turbidity, cloud and breaking swell create noise; and pixel resolution can blur narrow fringing forests.
Drones close the resolution gap. A photogrammetry or multispectral drone pass over a site resolves canopy at centimetre scale, distinguishes kelp from rock and turfs, and provides the ground-truth that calibrates the satellite classification. Vessel and ROV sonar extend the picture below the surface for submerged canopies, and diver transects anchor everything in species identity.
The deliverable is a time series: canopy extent, per site, per season, with classification confidence stated. Restoration projects add the comparison that makes everything possible — the mapped baseline and control beds against which change will be measured. Roots of the whole system are biological, though: timing surveys to the kelp life cycle matters, since a canopy mapped in the wrong season misreads everything downstream.
Step 2: From canopy to biomass — the allometry problem
A map tells you cover, not weight. Converting canopy area into tonnes of wet or dry biomass requires a transfer relationship, and building one is gloriously unglamorous work: divers harvest measured quadrats, weigh and subsample everything, and regress the numbers against what the sensors saw — canopy density, frond counts, canopy thickness from structure-from-motion models.
These relationships are site- and species-specific. A square metre of mature giant kelp canopy and a square metre of storm-thinned sugar kelp canopy do not hold the same biomass, any more than a winter forest and a summer forest do. Sound monitoring programs therefore:
- sample across seasons and along the site's exposure and depth gradients;
- re-sample after disturbance years so models stay honest;
- report biomass as a distribution with an uncertainty interval, never a single number.
This is the stage where lazy programs start borrowing literature values from other coasts, and where auditors start writing things down.
Step 3: From biomass to carbon — the chemistry step
Biomass to carbon is the most routine conversion in the pipeline, and still easy to do badly. Subsamples are dried, homogenised and analysed for tissue carbon fraction — the share of dry weight that is carbon, which varies by species, tissue type (blade, stipe, holdfast) and season. Multiply biomass by the measured carbon fraction and you have elemental carbon; multiply by the standard molecular-weight ratio of CO₂ to carbon (44/12) and you have CO₂-equivalent — the unit markets trade.
Tidewright's Canopy Ledger automates the bookkeeping here — every quadrat, analysis batch and conversion factor timestamped in a chain of custody (a fictional but representative implementation of where the field is heading) — precisely so that step three never becomes a spreadsheet legend nobody can reconstruct.
Step 4: From standing stock to sequestered carbon — the hard step
Standing stock is not sequestration. A hectare of kelp holding forty tonnes of biomass-carbon today may hold the same in a decade, having fixed and exported many times that amount in the meantime. Carbon accounting must therefore work on fluxes: what the forest fixes, what it exports, and — critically — where the exported fraction ends up. As set out in how kelp stores carbon, most detached kelp re-enters the fast carbon cycle through grazing and decomposition; only the fraction reaching durable stores — deep water, anoxic sediments — counts toward long-term removal.
Estimating that fraction on-site is the frontier of the whole discipline, and the toolkit is expanding:
- Sediment traps and cores downslope and offshore of the site measure kelp-derived material actually arriving and accumulating, identified by biomarkers and stable-isotope signatures.
- eDNA metabarcoding of sediments adds a second, independent line of evidence — kelp DNA persisting in receiving sediments traces export routes that traps can miss; the same eDNA methods used for biodiversity surveys do double duty for carbon-fate tracing.
- Tagged detritus and drifting studies follow fragments physically, revealing transport corridors — some coasts funnel kelp into submarine canyons, others strand it on beaches within days.
Methodologies increasingly handle the residual uncertainty with conservative default fractions plus discounts: claim only the lower bound of what the site's evidence supports, and let the unmeasured remainder remain unclaimed.
Step 5: Reversal accounting and buffer pools
Marine carbon claims must survive the question every verifier asks: what happens when a heatwave strips the forest? Marine heatwaves have removed whole regional canopies within a season, so a serious program treats standing-stock collapse as a quantified risk: canopy time series define the disturbance regime, reversal events trigger accounting adjustments, and a share of every issuance goes into a pooled buffer against future losses. Exported-and-buried fractions persist through a canopy loss; standing-stock-linked benefits do not — the accounting must say which is which.
Step 6: Reporting, verification, issuance
Finally the pipeline goes through paper. The project document assembles extent maps, allometric models, lab results, fate-tracing evidence, baselines and uncertainty statements into the audit package. Independent verifiers re-walk the logic — often including site visits and re-analysis of raw imagery — against the methodology's requirements. Credits are then issued on a registry with serial numbers, the buffer contribution deducted, and the full evidence pack becomes part of the public record. From first satellite pass to issuance, a rigorous project is measured in years, not quarters — a fact worth remembering when anyone offers you fast kelp credits.
Where this pipeline is going
Three trends will define the next few years: canopy classification improving as higher-resolution satellite constellations and better training data arrive; fate-tracing becoming cheaper and more routine as eDNA and biomarker methods standardise; and methodologies maturing from project-specific documents into adopted standards. The direction of travel is clear — from borrowed numbers to measured ones, per site, with uncertainty on the page. That is the only version of kelp carbon worth buying, and the only version we would sell.
Key takeaways
- Kelp carbon MRV is a six-step pipeline: map extent, convert canopy to biomass, convert biomass to carbon, estimate the durably sequestered fraction, account for reversal, then report and verify.
- Satellites map extent at scale, but drones, sonar and divers are needed to resolve species and calibrate biomass — canopy cover is not weight.
- Biomass allometry and tissue carbon fractions are site- and season-specific; borrowed literature values are a top audit failure.
- Standing stock is not sequestration; only measured export to durable stores (deep water, anoxic sediment) supports removal claims, traced with sediment cores, biomarkers and eDNA.
- Heatwave reversal risk must be priced into the accounting via buffers and conservative claims, distinguishing buried fractions from standing stock.
- Serious issuance takes years of evidence; fast kelp credits are a red flag, not a bargain.
FAQ
Can satellites measure kelp carbon directly?
No. Satellites measure canopy extent (and, imperfectly, canopy density), which is the first input to — not the answer to — a carbon estimate. Biomass conversion, carbon fraction analysis and export-fate tracing all require field and lab work. Any monitoring product that jumps from satellite pixels straight to tonnes is skipping the steps auditors care most about.
Why do the biomass models have to be site-specific?
Because canopy-to-biomass relationships vary with species, season, depth, wave exposure and recent disturbance. A model calibrated on storm-thinned winter canopy will misestimate a summer canopy on the same reef, let alone a different species on another coast. Seasonal sampling and post-disturbance re-calibration keep the conversion honest.
What counts as the 'sequestered' fraction?
Only the share of fixed carbon that reaches durable storage — deep-ocean waters isolated from the atmosphere for centuries, or oxygen-poor sediments where burial persists. The remainder cycles back through food webs and decomposition within years. Honest projects measure or conservatively bound that fraction on-site rather than applying global averages.
How long does it take to go from a new site to issued credits?
In a rigorous program, years: baseline mapping across seasons, model calibration, fate-tracing studies, draft project documentation, then verification and registry review. Programs that promise issuance in a single season are compressing the evidence steps, and the credits will carry that compression as risk.
What happens to the credits if a heatwave destroys the forest?
In a properly structured project, the reversal is reported, the standing-stock-linked claims are adjusted, and the shortfall is made good from the buffer pool contributed at issuance — while already-buried exported fractions, which persist regardless of canopy loss, remain credited. This is why the accounting separates stored carbon from standing stock, and why buffer rates for ocean projects should reflect real regional disturbance regimes.