Science11 min read
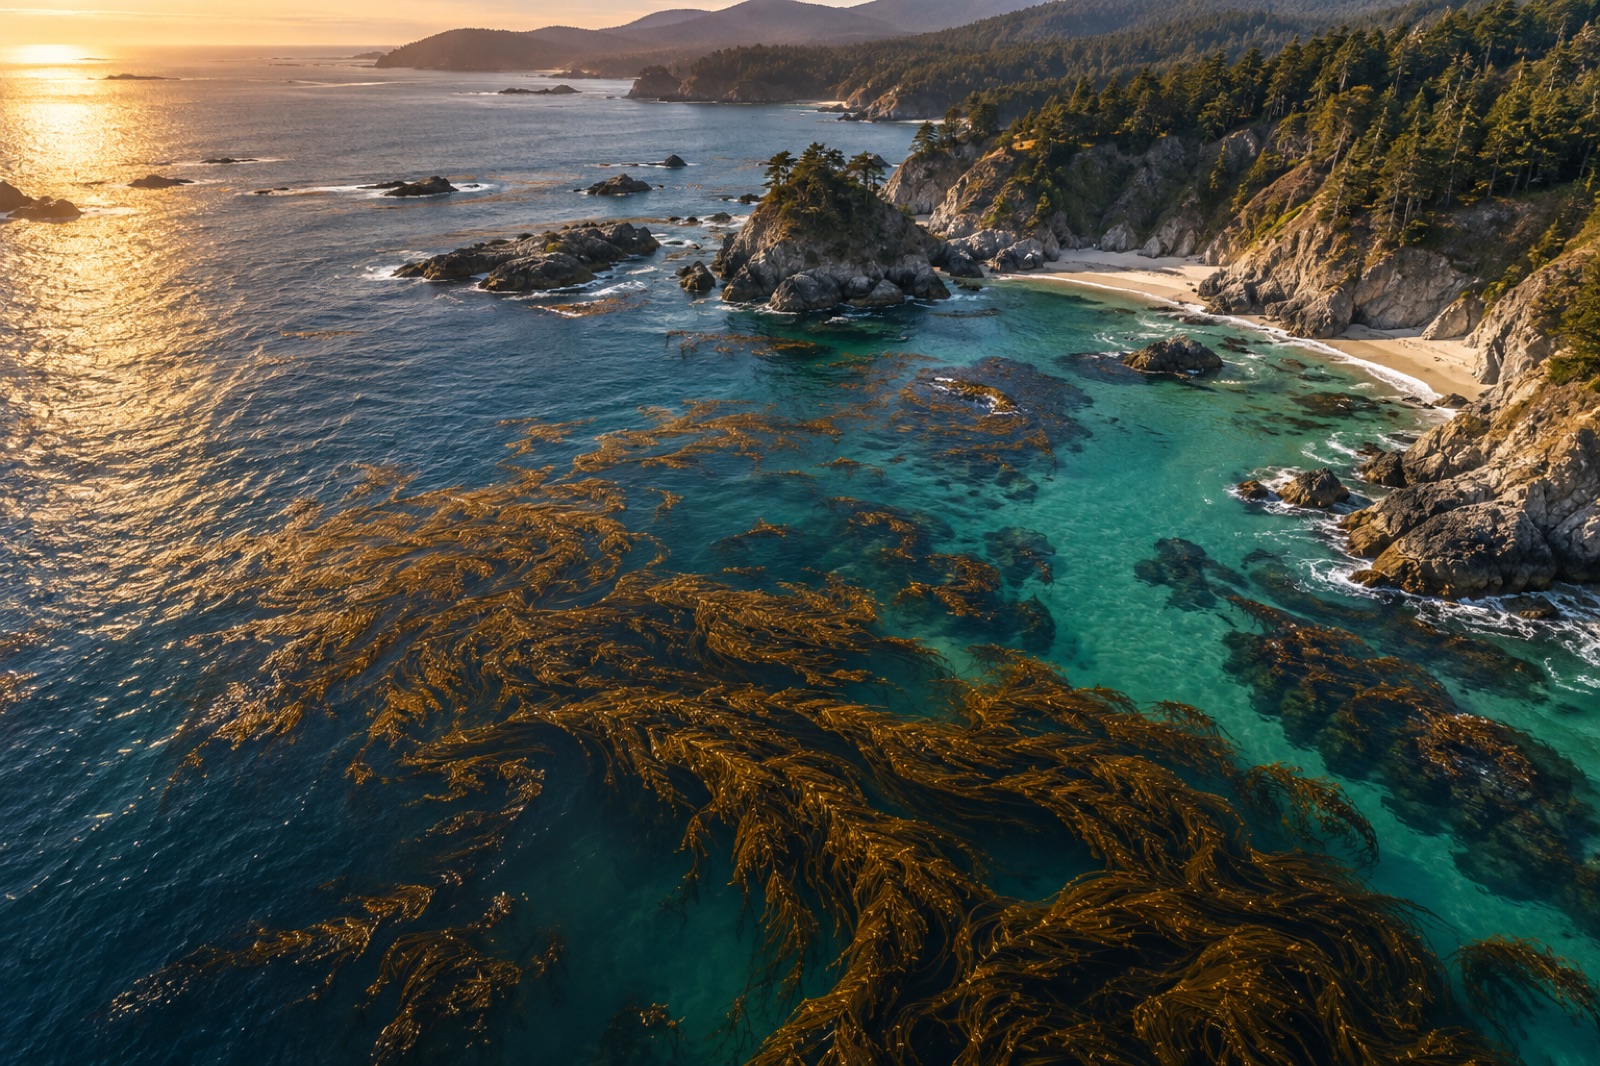
How Satellites See Kelp: Remote Sensing of Coastal Canopies
From Sentinel-2 pixels to drone orthomosaics, here's how scientists detect, map and track kelp forest canopies from space — and where the limits are.
Dr. Mara Ellison ·
How do you count fish you can't see? Acoustic surveys use sonar to turn echoes into biomass estimates. Here's how echosounders work — and their limits.
Ask a fisheries manager how many fish live on a reef, and the honest answer begins with a confession: nobody has ever counted them. Fish hide, school at night, scatter from boats, and live in water too deep or too dark to survey by eye. So scientists stopped trying to see fish and started listening for them instead. Acoustic surveys — sweeping the water column with sound and reading the echoes that come back — are the backbone of modern fish stock assessment and one of the core monitoring tools on any serious reef restoration program. Here is how they work, what they can tell you, and where they quietly run out of answers.
Sound travels through water far better than light does. A pulse of high-frequency sonar — typically between 38 and 200 kilohertz for fish surveys, well above anything we can hear — radiates down from a transducer in a widening cone. When the pulse crosses a boundary where density or sound speed changes, part of its energy reflects back. Many boundaries in the ocean reflect faintly: layers of plankton, temperature fronts, bubbles. One structure reflects brilliantly: the swim bladder.
Most bony fish carry a gas-filled organ that keeps them neutrally buoyant. Gas in water is an almost perfect acoustic mirror — the impedance mismatch is enormous. A fish with a swim bladder scatters far more sound per gram than a jellyfish, a squid, or a shark. This quirk of anatomy is what makes acoustic fish counting possible at all: the survey instrument effectively "sees" swim bladders, and everything else is inferred from there.
The echo returns to the transducer as a time-series of intensity. The instrument converts time back into range, producing an echogram — a colourful cross-section of the water column where schools appear as dense clouds, individual fish as small specks, and the seafloor as a bright, hard line at the bottom. A skilled analyst can read an echogram the way a radiologist reads a scan.
Turning squiggles on an echogram into "12,400 tonnes of sardines" involves a chain of measurements and assumptions, each with its own uncertainty.
The fundamental quantity is target strength — how loudly a single object echoes, measured in decibels. Decades of tank and in-situ experiments have produced equations linking target strength to fish length for major groups. A 30 cm fish echoes far more strongly than a 10 cm fish of the same species, so these length–target-strength relationships let analysts convert echo intensity into fish size, and size into biomass.
For diffuse layers of fish, analysts use echo integration: sum all the echo energy in a volume, divide by the average echo from a single fish of known size, and you get an estimate of how many fish were in that volume. Dense schools are the opposite problem — individual echoes blur together, so school shape, density and behaviour are classified instead, and each school gets a biomass figure from its volume and packing density.
The crucial catch: an echosounder mostly cannot tell you what species it is looking at. Returns are apportioned to species using whatever ground-truth exists from the same waters at the same time — trawl catches, camera drops, eDNA samples such as those described in our guide to reading a kelp forest from a bottle of seawater, or diver observations. If 80 percent of the ground-truth catch was horse mackerel, roughly 80 percent of the acoustic backscatter gets assigned to horse mackerel. Change the apportionment, and the stock estimate moves with it.
Whatever the platform, the physics is identical: transmit, listen, integrate, apportion.
Kelp forests are, acoustically speaking, hostile terrain. Three things conspire against the survey:
This is why kelp forest monitoring is always multi-method: acoustics for the water column and schooling species, diver and stereo-video transects for reef-associated fish, and cameras for the cryptic layer. At Tidewright, canopy mapping from satellites and drones tells us where the acoustic shadow will be deepest, so surveys can be timed for top-down sonar at slack water and paired with camera drops where the canopy is thickest. Our Drifter vessels carry both sonar and cameras for exactly this reason.
Strengths: enormous coverage compared to any visual method; day-and-night operation; non-extractive; continuous records from moored instruments; unmatched for schooling pelagic species over large areas.
Weaknesses: species identification is indirect; near-bottom and near-surface layers are poorly sampled; abstention of sound by dense canopy or bubble clouds; results are sensitive to the target-strength model and the apportionment data. Two reputable surveys of the same stock can disagree by tens of percent — which is why stock assessments treat acoustic biomass as one line of evidence among several, alongside catch data, age structure and independent trawl indices.
If you are handed a survey report — as a council officer, fishing cooperative or citizen scientist — look for four things:
Publishers of serious work show these openly. On Tidewright projects, survey metadata accompanies the findings on our open data portal, so partners can audit the whole chain from echo to estimate.
Survey echosounders use high frequencies at source levels far below those of concern for marine mammal disturbance, and most fish cannot hear above a few kilohertz at all. Scientific echosounders are considered among the lowest-impact survey tools — unlike loud low-frequency airgun arrays used in seismic exploration, which are an entirely different technology.
Echo character depends mostly on body size, orientation and swim bladder shape — and different species of similar size overlap heavily. Some groups have diagnostic school shapes or echo signatures, but in general, species identity comes from nets, cameras or eDNA, not sound.
Order-of-magnitude reliable, and typically within tens of percent when well calibrated and well grounded. Precision improves dramatically with repeated surveys of the same stock, because consistent method beats sporadic perfection.
Partly. Vessel-mounted downward-looking sonar struggles in very shallow, canopy-covered water, so shallow kelp surveys lean on cameras, divers and eDNA, with acoustics covering the deeper reef edge and the water column beyond it.
Much of it is — fisheries agencies publish survey reports, and research programs increasingly share processed echograms. Tidewright's own surveys of restored and reference reefs are published through our open data catalogue, alongside the methodology described on our impact methodology page.
From Sentinel-2 pixels to drone orthomosaics, here's how scientists detect, map and track kelp forest canopies from space — and where the limits are.
Dr. Mara Ellison ·
Healthy kelp forests crackle, rasp and croak. Researchers now eavesdrop with hydrophones to judge reef health — and even use sound as a restoration tool.
Dr. Mara Ellison ·
A map of the kelp forest food web — from drifting fronds and grazing urchins to otters, octopus and rockfish — and why detritus powers most of it.
Dr. Mara Ellison ·