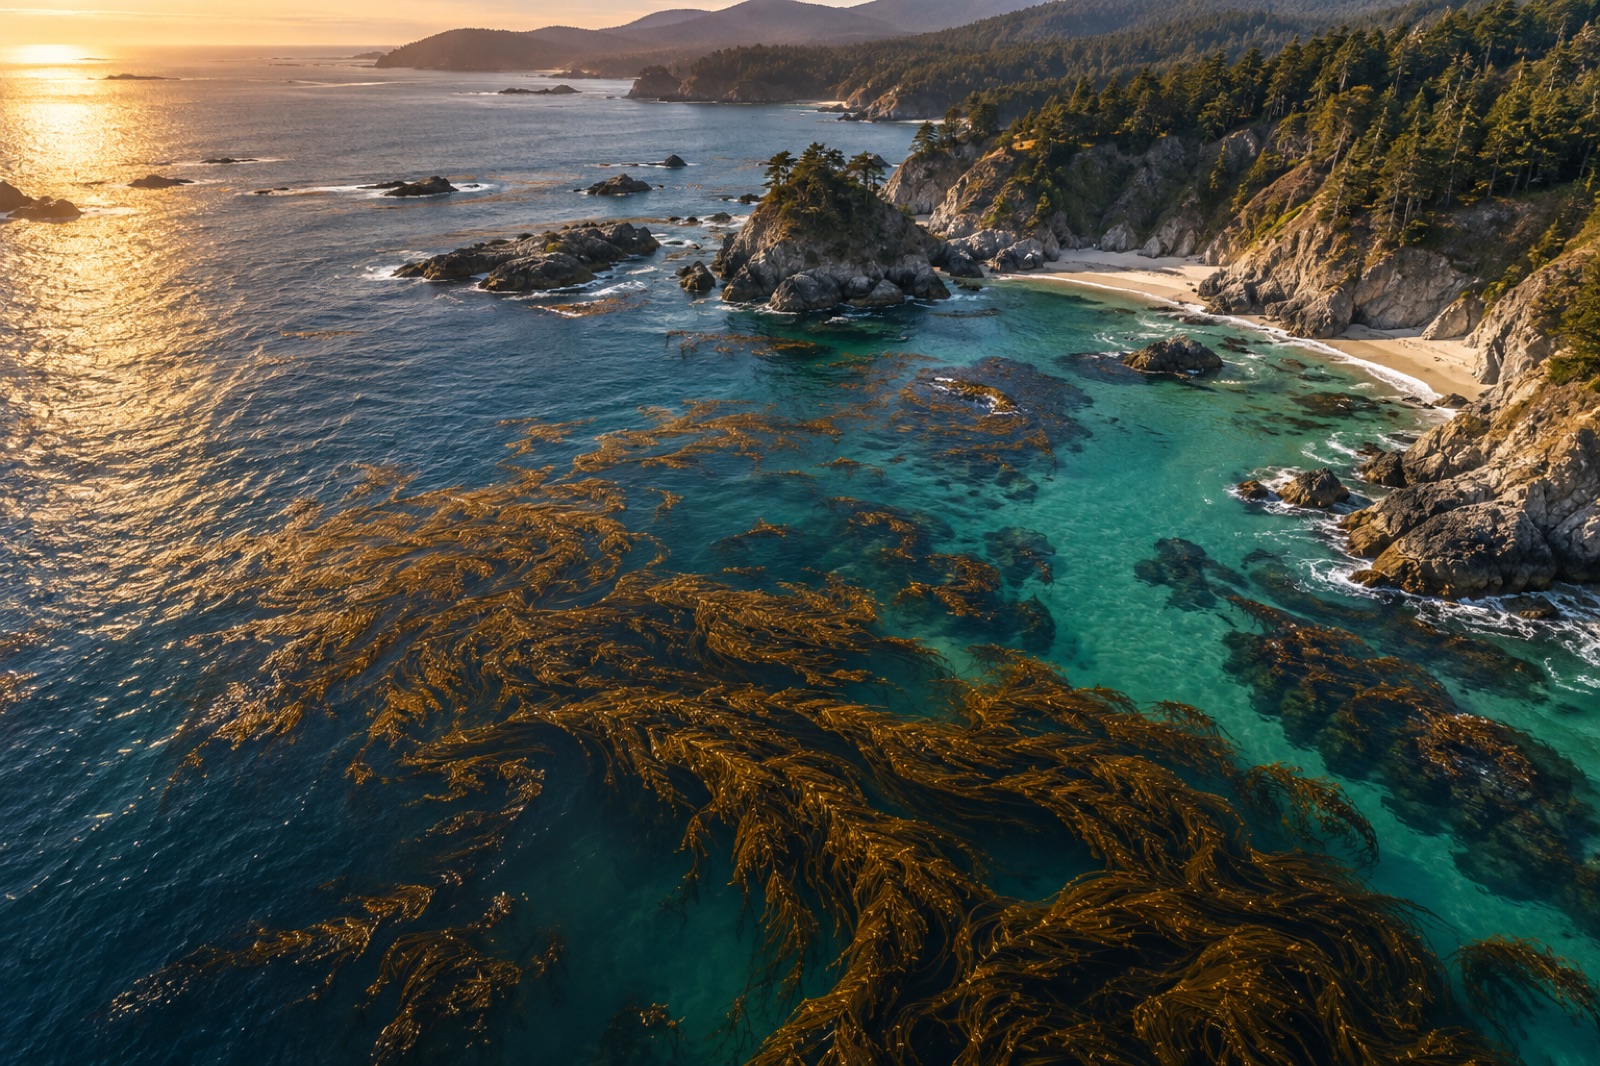
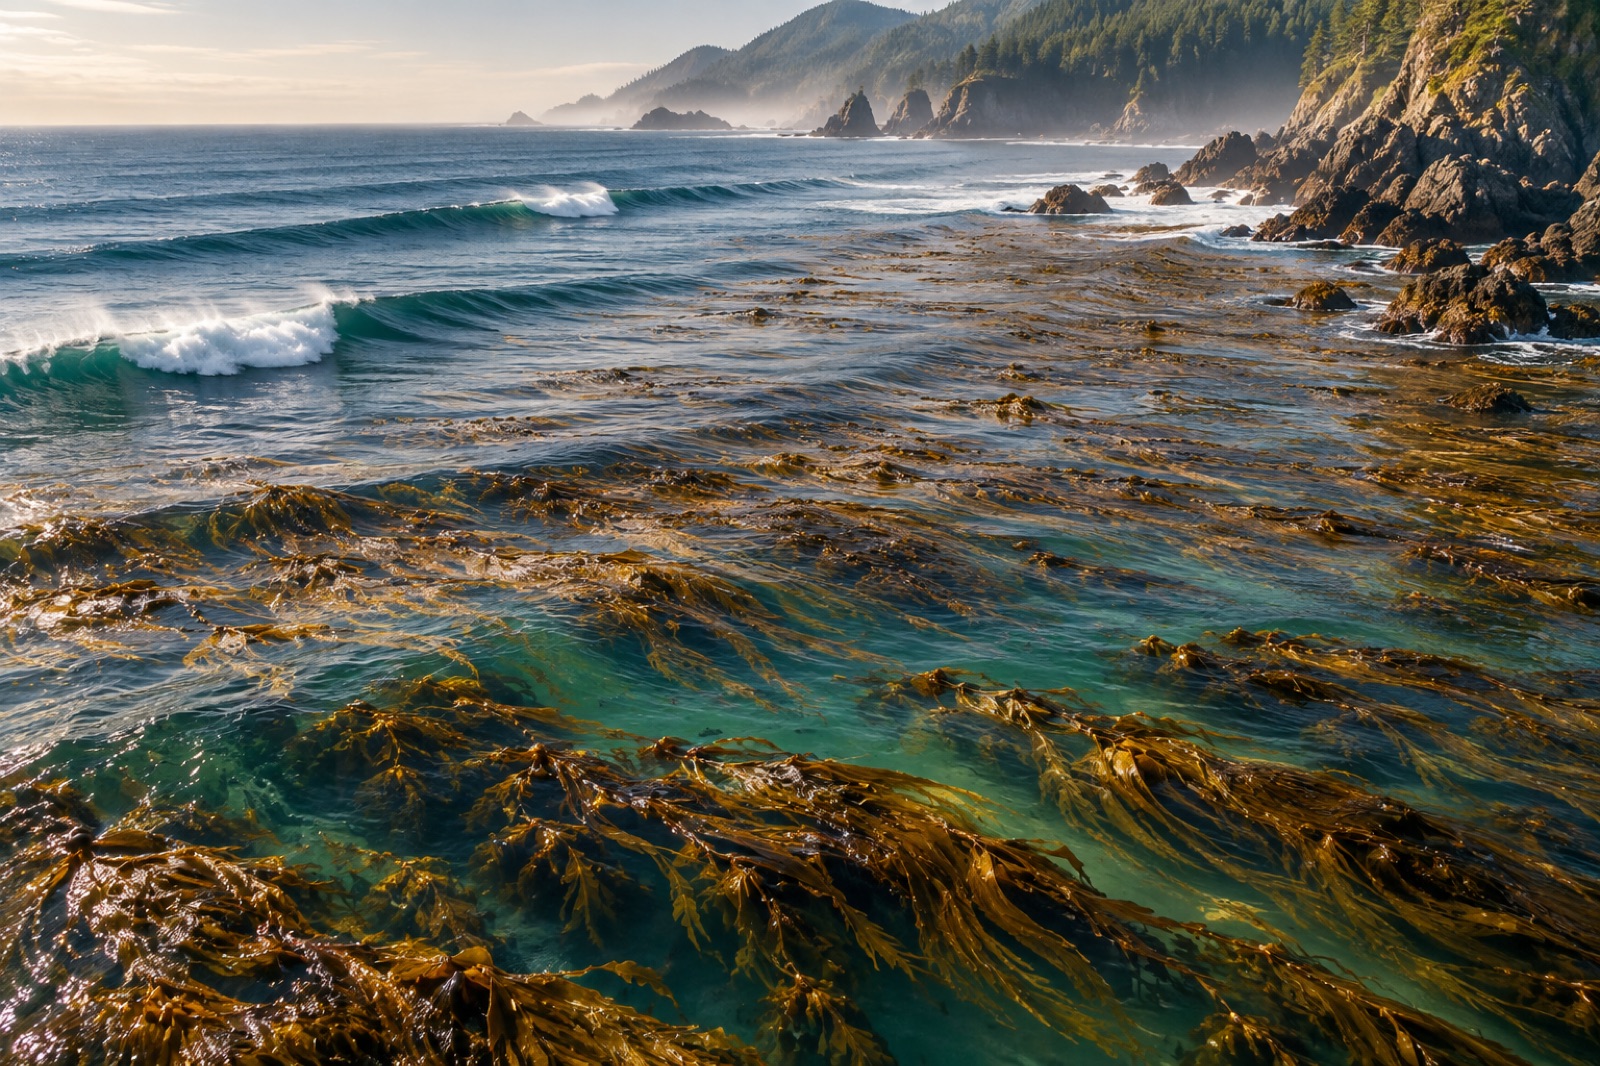
Every twenty minutes, somewhere on Earth, a kelp forest gains or loses a patch of canopy. Some of those changes we see — a crew on a boat, a diver with a slate. Most of them we would never see at all if we couldn't watch from above. Satellite remote sensing has quietly become the backbone of kelp monitoring: it lets ecologists track forest extent across whole continents, catch marine heatwave damage while it is still unfolding, and measure a restoration site's recovery year after year without putting a single fin in the water.
This explainer walks through how it actually works — the physics of why kelp is visible from orbit, which sensors do the work, how a raw image becomes a canopy map, and the honest limits of the method. It is also the foundation of our own Canopy Ledger platform, so we will point out where Tidewright's monitoring program (fictional, like all of Tidewright) plugs into the same science.
Why kelp is visible from space at all
Kelp is not green. Brown algae carry fucoxanthin, a pigment that absorbs blue-green light and gives the plants their olive-chocolate colour — the same pigment we describe in how kelp photosynthesizes. From a satellite's point of view, what matters is what happens at two ends of the spectrum.
In the near-infrared (NIR), healthy kelp tissue reflects strongly — much like terrestrial leaves — while open water absorbs NIR almost completely. A floating kelp canopy, or one sitting in the top metre or two of water, therefore lights up in the NIR band against a black ocean background. This contrast is the entire trick. Everything else in kelp remote sensing is refinement.
In the red and green bands, kelp absorbs more than bare water does, which darkens canopy pixels relative to their surroundings. Combine the two — darkened visible signal, brightened NIR — and you get a fairly reliable spectral signature, as long as the kelp is floating at or near the surface.
That last clause is the crucial caveat: satellites mostly see the canopy, not the forest. A giant kelp frond trailing along the surface is easy to detect. A dense understory five metres down, in turbid water, is effectively invisible to optical instruments. When you read a headline saying a coastline "lost 90% of its kelp," that number almost always refers to surface canopy area — the part a satellite can count.
The workhorse sensors
Three families of instruments do most operational kelp mapping today.
Sentinel-2 (European Space Agency) carries a multispectral imager with 10-metre pixels in the visible and NIR, revisiting any given coast roughly every five days (effectively more often where two satellites' paths overlap). Ten-metre resolution is coarse enough that a small bed can fall below detection, but fine enough to track major forests — and the archive is free, which is why Sentinel-2 underpins much academic kelp work.
Landsat 8 and 9 (USGS/NASA) deliver 30-metre pixels with a remarkably long record: the Landsat series reaches back to the 1980s, and researchers have mined that archive to reconstruct decades of canopy change. Landsat's thermal bands also give sea-surface temperature in the same image, which makes it a powerful tool for linking canopy loss to marine heatwaves on exactly matched dates.
PlanetScope and other commercial constellations trade radiometric precision for 3–5 metre pixels and near-daily revisits. For narrow, fringing kelp beds — the kind that hug rocky coastlines from Monterey Bay to Hokkaido — that extra resolution can be the difference between seeing the forest and missing it entirely.
Sunglint — sunlight reflecting directly off the sea surface into the sensor — can mimic or mask kelp, so good pipelines screen for glint angles and use glint-correction algorithms before anything else.
From pixels to a canopy map
A defensible kelp map is not a single threshold applied to a single image. A typical workflow looks like this:
- Assemble a stack. Analysts pull every usable image of the target coast over a season or year, often hundreds of scenes.
- Mask the land. A predefined coastline cuts out terrestrial vegetation, which otherwise shares kelp's NIR brightness.
- Correct the atmosphere and sun geometry. Rayleigh scattering, aerosols and sunglint are modelled out so pixel values are comparable across dates.
- Compute spectral indices. The classic choice is a normalized difference between NIR and red or green bands, tuned for water-covered vegetation.
- Classify. A threshold or trained classifier (random forests are common) labels each pixel canopy / no canopy.
- Composite across time. The classifier's per-scene outputs are combined — a pixel that shows kelp on any clear date in the window joins the seasonal maximum-extent map. This step controls for tides, wind chop and the daily disappearance of canopy under a rough surface.
- Validate. Drone surveys or small-boat transects on a subset of sites check that the map matches reality, and the accuracy statistics get published with the map.
That seventh step is where credibility lives. A map without field validation is a hypothesis, not a measurement — a philosophy we build into our impact methodology as well.
What satellites cannot see
Being honest about limits is part of using the tool well:
- Depth and turbidity. Water absorbs NIR quickly; canopy more than a couple of metres down in murky conditions fades from view. Estuaries, glacial meltwater plumes and post-storm sediment all degrade detection.
- Cloud. Coasts like Vancouver Island or Norway's can go weeks without a clear pass, which is why multi-scene compositing matters so much.
- Species resolution. From orbit, giant kelp and bull kelp both read as "canopy." Telling species apart usually needs hyperspectral data or eyes in the water.
- Density versus presence. Maps report area covered, not biomass. A thin, stressed canopy can occupy the same pixels as a lush one.
- Submerged forests. Species like golden kelp that rarely reach the surface in deep water are structurally undercounted by any optical satellite.
None of these are fatal flaws. They are arguments for layering satellite data with drones, acoustic surveys and diver transects rather than treating any single layer as truth.
How Tidewright uses this stack
Tidewright's monitoring program (all illustrative — Tidewright is a fictional demonstration company) follows the same physics with a restoration lens. Our fictional Canopy Ledger platform composites Sentinel-2 and commercial 3-metre imagery over each project site every week, flags canopy anomalies against a five-year baseline, and dispatches a drone or Drifter survey when a patch behaves unexpectedly. At reseeded sites — say, the reefs around Maria Island — the satellite layer is the first coarse answer to the question every funder asks: is anything growing?
The satellite is then backed up by two ground-truth layers we have written about separately: eDNA surveys that confirm which species the canopy actually contains, and diver transects that measure juvenile density long before young plants reach the surface — often eighteen months before a satellite could possibly see them.
Why it matters beyond accounting
Remote sensing changed kelp science politically as much as technically. Before wall-to-wall canopy time series existed, kelp loss was easy to dismiss as anecdote: a diver's memory, a fisher's complaint. A thirty-year, continent-scale image record is much harder to wave away. The Great Southern Reef's decline, documented in the Great Southern Reef atlas guide, became undeniable once consistent canopy series showed the trend was regional, synchronized and aligned with temperature anomalies.
For restoration, the same record sets the bar for honesty. If a project claims recovery, the satellites — operated by agencies with no stake in the outcome — either show expanding canopy or they don't. That independence is exactly what makes remote sensing the floor of any credible blue-carbon claim, alongside the measurement framework described in MRV explained.
Key takeaways
- Kelp is detectable from orbit because healthy canopy reflects near-infrared strongly while water absorbs it; the signal is strongest for floating or shallow canopy.
- Sentinel-2 (10 m, free, ~5-day revisit) and Landsat (30 m, 40-year archive) do most scientific mapping; commercial 3–5 m constellations cover narrow fringing beds.
- Robust maps come from multi-image seasonal composites with atmospheric and sunglint correction plus field validation — never a single scene.
- Satellites undercount submerged, turbid-water and understory kelp; drones, acoustics and divers are needed for the full picture.
- Long, independent satellite records are politically powerful: they turn kelp loss from anecdote into documented trend and hold restoration claims to account.
FAQ
Can satellites measure how much carbon a kelp forest stores?
Only indirectly. A satellite canopy map gives area; converting that to biomass requires field or drone calibration, and converting biomass to durable carbon storage is a further, contested step. See how kelp stores carbon for the full accounting.
How often is a given coastline imaged?
With clear skies, Sentinel-2 revisits roughly every five days and commercial constellations can image daily. In practice, cloud cover means usable observations every two to six weeks on many temperate coasts, which is why seasonal composites are standard.
Why do some kelp maps disagree with each other?
Different sensors, different seasons, different classification thresholds — and different definitions of what counts as canopy. A map strict about detection will show less area than a generous one. Comparing trends from a single consistent method is far safer than comparing absolute numbers across studies.
Are there sensors other than optical satellites for mapping kelp?
Yes. Airborne and satellite hyperspectral imagers can sometimes separate species, and airborne lidar (bathymetric, green-wavelength) can detect submerged vegetation in clear water. Acoustic sonar from vessels maps three-dimensional forest structure below the surface. Each trades coverage for detail.
Could a hobbyist build a kelp canopy map?
Increasingly, yes. Sentinel-2 and Landsat data are free, and cloud platforms host analysis-ready archives. An enthusiast with basic scripting skills can reproduce a simple seasonal canopy index for their local coast — a genuinely useful citizen-science contribution for remote, under-monitored shorelines.