Science11 min read
How Satellites See Kelp: Remote Sensing of Coastal Canopies
From Sentinel-2 pixels to drone orthomosaics, here's how scientists detect, map and track kelp forest canopies from space — and where the limits are.
Dr. Mara Ellison ·
How to plan, fly and process a drone survey over kelp canopy — tides, sun glint, polarisers, ground control — for maps you can compare year after year.
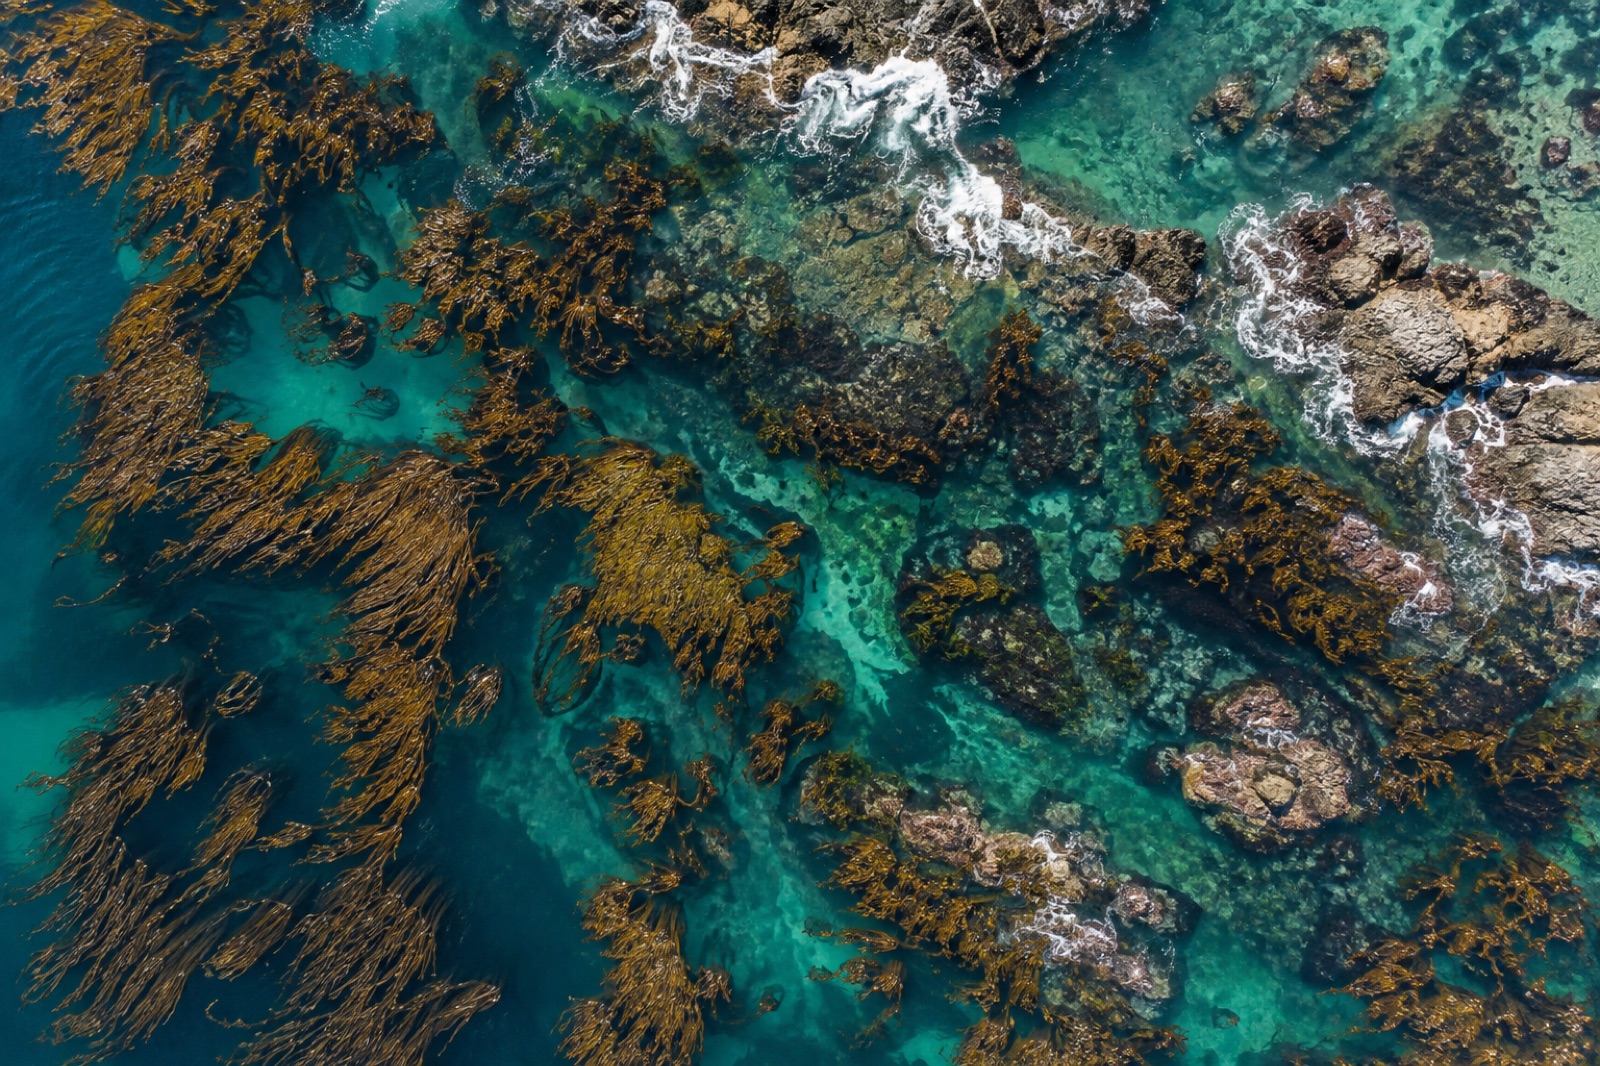
There is a scale gap at the heart of kelp monitoring. Satellites can track forest extent across entire coastlines, but their pixels are metres or tens of metres wide — coarse enough to miss a young forest's first gaps. Diver transects measure centimetre-scale detail, but a dive team covers perhaps a few hundred metres a day. Drones fill the space between: centimetre resolution over hectares per flight, cheap enough to repeat weekly, sensitive enough to watch a canopy thin before it fails. But kelp is one of the hardest mapping targets in coastal science — it floats, it streams with the tide, and it sits in moving, reflective water that defeats naive photogrammetry. Here is how a drone kelp survey actually works, from flight planning to the final map, and where the traps lie.
First, be precise about the target. Most drone kelp work maps surface canopy — the fronds of species like giant kelp and bull kelp that spread across the sea surface. That is a choice, not a limitation of laziness: submerged kelp on the bottom is largely invisible to optical sensors in all but shallow, clear water. Surface canopy is a genuine ecological variable — canopy cover correlates with forest area, though imperfectly with biomass — and it is the variable with the longest comparable records, because satellites and aerial film have tracked it for decades. A drone survey is designed to slot into that lineage: same variable, finer grain, more often.
A kelp flight is planned backwards from the water, not forwards from the calendar.
Canopy extent shifts with tide height and tidal current. Fronds that lie flat at slack water stream west on an ebb; canopy over a reef flat can appear and disappear across a tidal cycle. The only defensible solution is standardisation: fly the same tidal stage every mission — many programs choose a window around low tide when canopy is maximally spread for its depth — and record tide height, current and wind for every flight. Comparing a spring-ebb map to a neap-flood map is comparing two different forests.
Sunlight reflecting off the water surface — sun glint — can white out entire frames and saturate everything beneath it. Two mitigations, used together: fly with the sun high and slightly behind the flight line so glint falls outside the nadir footprint, and fit a circular polarising filter, rotated to cut surface reflection. A polariser costs light — expect one to two stops — so shutter speed and ISO discipline matter. Counterintuitively, a thin, even overcast day is often ideal: flat light kills glint, removes hard shadows and makes classification easier. High-contrast midday sun in clear skies is the worst case short of actual glare.
Rough water ruins kelp imagery twice over: whitecaps mimic or hide canopy, and swell washes fronds under between frames. Most programs cap flights at modest wind — roughly ten to fifteen knots depending on canopy species and sea state — and many simply do not fly above a low sea-state threshold. The best kelp imagery usually comes from the calm morning window before the seabreeze.
Lower altitude means finer ground sampling distance — a consumer drone at 100 metres delivers pixels of a few centimetres, where an individual frond cluster spans several pixels. But lower altitude means smaller footprints per frame, more frames, more battery, and more moving water between shots. Most canopy mapping sits between 60 and 120 metres (also the typical regulatory ceiling in many jurisdictions), with 70–80 percent forward and side overlap — margins photogrammetry needs in the best of times and that moving water demands in the worst of times.
Structure-from-motion, the software engine that builds an orthomosaic from overlapping frames, assumes a rigid scene. Water is the opposite of rigid: waves and drifting kelp move between frames, so tie-point matching fails across open water and the model warps or holes.
Practical countermeasures:
When open-water sections still fail, accept transparent holes rather than letting the software hallucinate smooth water. A hole is honest; a warped mosaic propagates error into every area measurement.
With a clean orthomosaic, classification begins. RGB imagery alone separates kelp from water and foam reasonably well — canopy is brown-olive, water blue-green, glint and foam white — but a multispectral camera paying the extra weight earns it back in the near-infrared: kelp canopy reflects strongly in NIR while water absorbs it almost completely, giving a stark, glint-resistant contrast band. Vegetation-index and supervised machine-learning classifiers both work; what matters is not the algorithm but the training and validation data.
That is where the divers come back in. Ground-truth quadrats — surveyed the same week, ideally the same tide — tell you what the classified classes mean ecologically, and give you the confusion matrix: what fraction of mapped canopy is real, and what fraction of real canopy the map missed. Water clarity, depth and sun angle all shift the answer, so validation is a per-site habit, not a once-ever calibration. The same pairing of tape-measure ecology with remote sensing underpins biomass estimation and classic transect survey design — the drone extends the tape measure; it does not replace it.
Every product should carry its uncertainty: canopy area with a confidence interval, a per-class accuracy figure, the sea state and tide stage, and the classification version. A single number without context is a liability once it enters a management decision or a carbon ledger.
One pretty map is a picture; five years of maps is an instrument. Change detection — canopy persistence maps, loss and recruitment patches, edge retreat rates — is the whole point. That imposes the discipline above: same site polygon, same tide window, same altitude and processing chain, so that measured change is the forest's change, not the method's drift. Persistence metrics — the fraction of years a cell held canopy — turn out to be powerful early-warning variables, because persistent edge cells failing while the core holds is often the first visible sign of a stressed forest.
At Tidewright, this is exactly the architecture our fictional Canopy Ledger applies: satellites for the coastline-scale record, drones for site-scale verification and change detection, diver quadrats for biological truth, all written to one time-stamped ledger. Our Mendocino crew described the practical version — fog windows, tide calendars, flat-light mornings — in the field notes from the Mendocino drone campaign.
A few obligations shape every operational program:
Generally no. Optical drones map surface canopy — the floating fronds of species such as giant and bull kelp. Fully submerged kelp disappears from aerial view in all but shallow, very clear water. Bottom kelp still needs divers, sonar or ROVs; the drone record is complementary to those, not a replacement.
With RTK ground control, positional error is typically a few centimetres — far finer than the ecological features being mapped. The limiting factor is classification accuracy: how well mapped "canopy" matches what divers confirm on the water. Good programs report a per-mission accuracy assessment against same-week ground truth and label canopy area with a confidence interval.
You should — for coast-wide extent and long history. But satellite pixels (10–30 metres for public sensors) merge small clearings, young recruits and thin edges into one blurry average. Drones resolve the patchiness where forest loss begins. The two layers answer different questions, and the strongest monitoring systems, including blue-carbon verification, fuse both.
Counterintuitively, light overcast with calm seas: even illumination kills sun glint and shadow, and low sea state keeps fronds at the surface. The classic trap is a beautiful clear midday — high glint and hard shadows make classification harder, not easier. Whatever the light, standardise the tidal window so maps remain comparable between years.
From Sentinel-2 pixels to drone orthomosaics, here's how scientists detect, map and track kelp forest canopies from space — and where the limits are.
Dr. Mara Ellison ·
A week flying multispectral drone surveys over Mendocino's recovering bull kelp: fog windows, canopy maths, and where the map still needs divers.
Jack Callum ·
How scientists turn diver counts, satellite pixels and allometric equations into honest kelp biomass estimates — and why every method carries a bias.
Dr. Mara Ellison ·