Science11 min read
How Satellites See Kelp: Remote Sensing of Coastal Canopies
From Sentinel-2 pixels to drone orthomosaics, here's how scientists detect, map and track kelp forest canopies from space — and where the limits are.
Dr. Mara Ellison ·
How scientists turn diver counts, satellite pixels and allometric equations into honest kelp biomass estimates — and why every method carries a bias.
Ask a kelp ecologist how much kelp is in a forest and you will get a long pause before the number. That pause isn't evasion — it's honesty. Biomass is the single most-requested kelp statistic ("how many tonnes did the coast lose?", "how much carbon is in that canopy?") and the hardest to measure well. A kelp forest is a three-dimensional, wave-tossed, seasonally pulsing structure that grows, sheds and regrows on timescales of weeks. No single instrument sees all of it.
This explainer walks through the toolbox — from a diver with a measuring tape to machine-learning models fed by satellites — and shows how the methods chain together. It also explains why biomass estimates always come wrapped in uncertainty ranges, and what a credible number (like the illustrative figures on our impact dashboard) actually had to survive before it was published.
Biomass is the currency that translates ecology into decisions. Fisheries managers use it to set urchin harvest targets. Restoration programs use it to prove a site recovered rather than merely greened up. Blue-carbon accountants — as discussed in how kelp stores carbon — need biomass as the first term in every sequestration calculation, because you cannot budget carbon you cannot weigh.
Yet kelp resists weighing. Unlike a tree, which more or less stays where you measured it last year, a giant kelp plant can add tens of metres of frond in a season and lose the lot in a single storm. Its "standing stock" — the biomass present at one moment — can halve between monthly surveys without anything being ecologically wrong. Good biomass science therefore measures dynamics (production and loss) as well as snapshots.
Everything rigorous in kelp biomass still starts underwater, because only divers see the whole forest — including the understory that satellites miss entirely.
The classic survey places a quadrat (a square frame, typically 1 m²) at random or fixed positions along a transect line. Inside each quadrat, divers count kelp plants and record stipe numbers per plant — stipes being the stem-like stalks that rise from the holdfast. Stipe count is the workhorse metric because it is fast, repeatable and strongly correlated with plant size.
You cannot harvest every plant in a quadrat to weigh it, so researchers harvest a sample once, across a range of plant sizes, and fit a regression: stipe count (or stipe diameter, or frond length) in, wet mass out. These equations are called allometric relationships, and they are the quiet machinery under nearly every published kelp biomass figure.
Allometry has rules that careful programs respect:
The output of a dive survey is biomass per square metre. Scaling that to a bay or a coastline requires knowing how many square metres are actually forested — which is where the eyes in the sky come in.
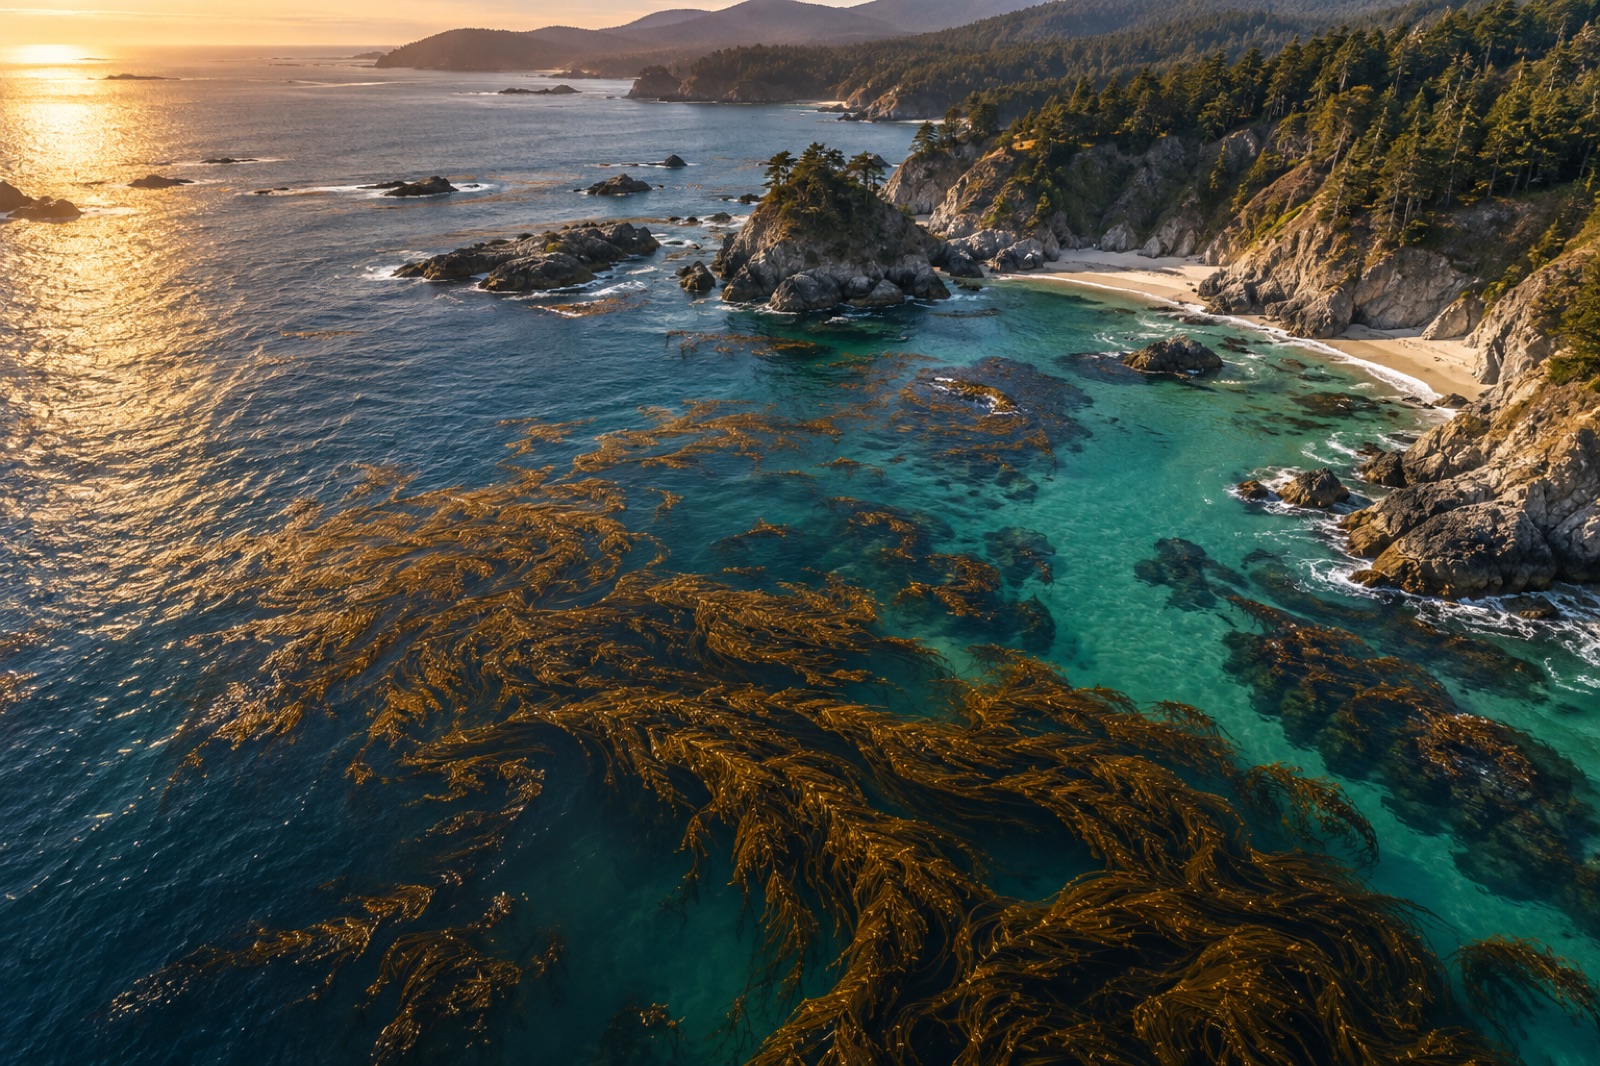
As we detail in how satellites see kelp, optical satellites detect floating and near-surface canopy with high confidence. That gives an excellent measure of canopy area — but area is not mass. Two hectares of sparse bull kelp fronds and two hectares of mature giant kelp canopy can occupy identical pixels and differ in biomass by an order of magnitude.
Modern pipelines therefore combine the two scales:
The decisive point: the satellite never measures biomass directly. It measures area with superb coverage, and the dive-calibrated model does the weighing. This hybrid approach is what powers large monitoring platforms — including our own Canopy Ledger, whose illustrative biomass figures are built on exactly this dive-plus-canopy logic (Tidewright is a fictional demonstration company, but the method is real).
Where water is too turbid for cameras — plankton blooms, glacial silt, storm runoff — sound steps in. Multibeam and split-beam echo sounders, the same instruments fisheries use to count fish, can detect kelp as a mid-water scattering layer between the bottom echo and the surface. Acoustic biomass surveys offer full water-column coverage from a moving vessel and work day and night.
The catch is interpretation. Kelp fronds, schools of small fish and plankton layers all return acoustic energy, so kelp detection depends on shape analysis, validated against ground-truth dives — there is that word again. As with eDNA (see reading the sea in a litre of water), the glamorous new method still leans on divers to keep it honest.
Airborne bathymetric lidar can map shallow kelp in clear water by measuring the green laser return off canopy versus bottom, but cost and limited water penetration keep it a niche tool for harbour-scale projects rather than coastlines.
A defensible regional biomass estimate looks something like this:
Any program that hands you a single precise-sounding figure without an uncertainty range or a survey date is telling you less than half the story.
Here is the subtlety that trips up most kelp-carbon conversations. Standing stock — what is present on census day — is not what enters carbon budgets. Kelp continuously sheds blades, erodes frond tips and exudes dissolved organic matter; that exported material is what can drift to sediments or the deep sea and contribute to sequestration (a pathway we unpack in where kelp carbon goes).
Measuring that export means measuring net primary production: punch holes in blades and track their migration along the frond (kelp grows from a meristem at the blade base), collect shed tissue in trap racks, or model growth from tagged plants. Production typically exceeds standing stock annually, because the forest is a fountain, not a warehouse. Biomass surveys tell you the size of the fountain's basin; production studies tell you the flow.
Satellite pixels record reflected light, not mass. A canopy pixel tells you kelp is present and roughly how dense the surface cover is, but biomass per pixel depends on plant age, species and season. Researchers must calibrate the spectral signal against harvest or stipe-count data from real dives, which is why biomass maps always trace back to somebody underwater with a tape.
Programs vary, but a regional baseline might use 40–100 transects stratified across habitat types, with 8–12 quadrats per transect. Trend monitoring re-visits fixed transects annually at the same season; even modest fixed networks detect large declines reliably, because removing site-to-site noise sharpens the signal enormously.
Fresh kelp is 80–90% water, so wet mass exaggerates the ecologically and economically relevant quantity. Dry mass (after oven-drying a sample) is the standard for carbon and food-web calculations, and carbon fraction (roughly a quarter to a third of dry mass) is measured separately, as it varies with species, season and tissue type.
Drones deliver superb fine-scale canopy maps in clear, shallow water and are now standard kit. But they still cannot see the understory reliably, cannot count stipes, and cannot collect tissue for allometry or chemistry. They are a complement that dramatically improves scaling between dive sites, not a replacement.
Usually because they measure different things: canopy area versus full-forest biomass, different seasons, different baselines, or different allometric assumptions. A "95% canopy loss" headline and a "40% biomass decline" can describe the same event consistently. Comparing studies means comparing methods first — which is exactly the discipline a public methodology page is for.
From Sentinel-2 pixels to drone orthomosaics, here's how scientists detect, map and track kelp forest canopies from space — and where the limits are.
Dr. Mara Ellison ·
Environmental DNA lets scientists census a kelp forest from a few litres of seawater. How eDNA surveys work, what they miss, and why they matter.
Dr. Mara Ellison ·
How kelp alternates between a visible sporophyte forest and a microscopic gametophyte generation — and why that hidden half decides whether forests recover.
Dr. Theo Nakamura ·