Field Notes8 min read
Field Notes, Tasmania: First Light on the Holdfast Lines
A Tidewright field note from Maria Island, Tasmania: deploying Holdfast seed lines onto heat-struck reef at dawn, and what we found three months on.
Jack Callum ·
Tr L-7 is a single 30-metre transect off Tasmania surveyed every month since 2021. Five years of unglamorous re-measurement turned out to be our sharpest instrument.
These field notes describe Tidewright's own fictional monitoring record. The ecology of succession is real; the transect, its numbers and its tape are ours.
There is a yellow measuring tape bolted to the floor of a gully off Tasmania's east coast. Transect L-7: thirty metres of permanently fixed line, running from a surge channel to a boulder field, on the Lumeriah Coast project. Every month since the autumn of 2021 — regardless of weather, crew rotations, budget meetings, vessel schedules or anything else that felt more urgent — a pair of divers has put a one-metre quadrat down along that line, photographed it, counted everything in it, and swum home.
Fifty-six months later, L-7 is the piece of monitoring infrastructure I would save from a fire. Not the drones, not the satellites, not the fleet. A bolted-down tape, and the stubbornness to keep re-measuring the same forty square metres of ocean floor. This note is about what staying still has taught us that all our moving technology could not.
Tidewright's monitoring machine is genuinely good: Drifter sonar passes map the habitat at hectare scale, satellite canopy indices track surface cover across the whole coast, eDNA bottles read the species roster from drifting DNA. But those tools share a silent weakness: each measures the forest in a different way, at a different moment, through different weather. Stitching them together is statistics. And statistics can lie smoothly when anything in the chain shifts — a sensor ages, an algorithm updates, a processing pipeline gets quietly improved by a well-meaning engineer.
A fixed transect doesn't have that problem. The tape hasn't moved in five years. The quadrat is the same plastic frame. The divers change, the counts are calibrated, and the result is a time series where any change is real, because nothing else changed. When we want to know if the technology is telling the truth, L-7 is where we check.
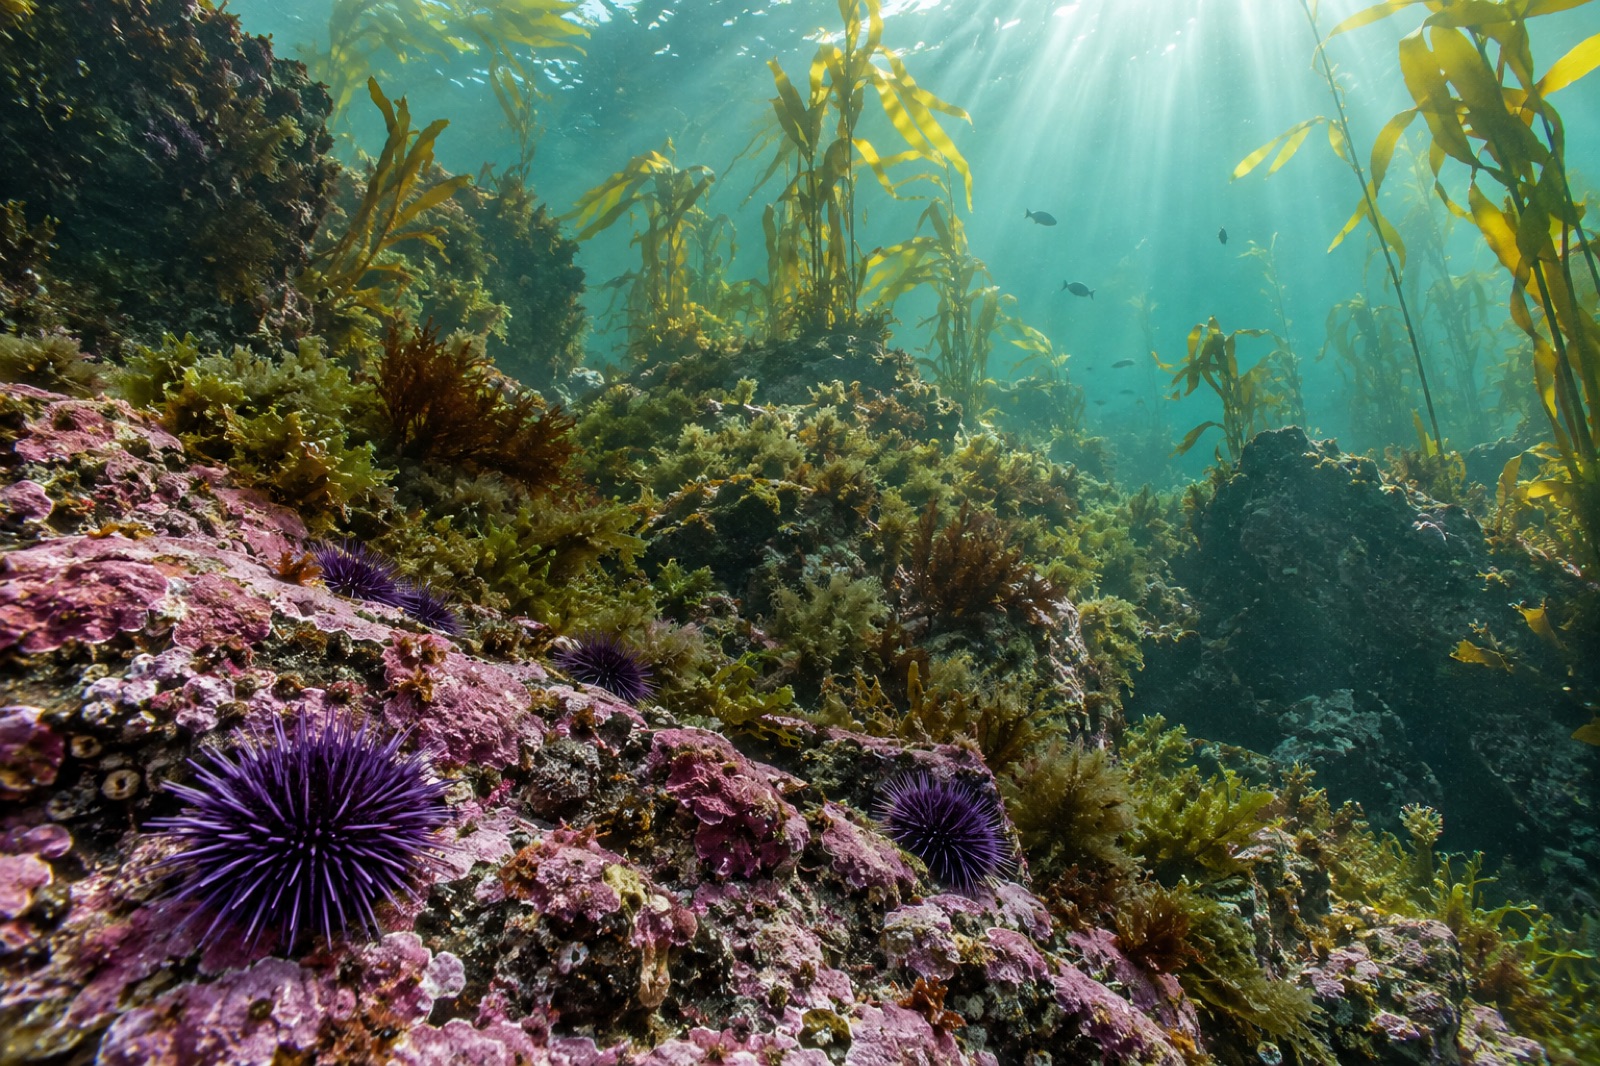
When the tape went down, the block was textbook urchin barren: bare rock, coralline paint, and purple urchins in every quadrat — densities around thirty per square metre, in poor condition. Kelp: zero. Fish: a handful of wrasse passing through. The monthly dive took twenty minutes; there wasn't much to write down.
Holdfast lines went in that autumn. By winter the quadrats along the tape held juvenile sporophytes in single digits. What L-7 saw that the satellites couldn't: recruitment was spatially ridiculous. One quadrat held forty-one juveniles; its neighbour, eighteen months later, still held four. The seed lines paid out in ridges, and the tape proved it with a granularity no drone will ever have.
This is the year that turned the transect from a chore into the highlight of the month. The order of ecological arrivals, month by month, quadrat by quadrat:
That sequence — canopy, then grazers, then understory, then fish — is the textbook story of ecological succession. Reading it in a textbook is one thing. Watching it happen, in order, on the same forty square metres, is another. The tape made the argument impossible to dodge: this is not a greener barren. This is a different ecosystem reassembling itself.
Year three taught the year's humility lesson: the kelp forest got worse. Canopy thinned after a warm late-summer pulse — our marine heatwave tracking rated it mild, but mild is a property of the whole coast, not of one gully — and urchin counts rebounded to double digits. For a quarter, the dashboards looked like reversal. If we'd had only annual surveys, the project report would have lost a year's confidence.
L-7 kept counting. The recovery came from below: understory turf, the abalone, the fish, none of them blinked. The wobble was canopy-only. By spring the kelp was back, denser, and — the fine detail the tape clinician caught — sturdier, individual stipe counts lower but biomass per plant higher, as if the forest spent the warm summer consolidating. That interpretation is now part of how we design for the next forty-degree week: we expect the wobble, and we don't panic it into an intervention.
This year's quiet sensation arrived in June: weedy seadragons, two of them, photographed in quadrat 19 by a dive pair who had to be calm enough not to disturb them to record it. Seadragons are canopy-habitat specialists; they do not visit barrens. Somewhere in the wider cove, L-7's sixty hectares of recovery had crossed some threshold of habitat value that a cryptic, finicky species voted on with its feet.
The transect can't tell us where they came from. But it can say, with a straight face and five years of data, that they arrived after the urchins left and the understory assembled. Sequence matters.
Let's be honest about cost, because monitoring budgets die of romanticism as often as of neglect:
If you're establishing your own monitoring — as a council, a fishery, a community group, or a citizen-science reef survey — you can copy this: bolt down a tape, pick a quadrat size, write down the protocol on one page, and guard the monthly slot on the calendar like a lease. The first year will feel tedious. The fifth year will feel like owning a lighthouse.
In the dive shed there's a laminated card above the gear rack; on it, in marker, are the four rules of L-7:
Same tape. Same quadrat. Same protocol. Every month. Weather permitting, nothing else excused.
The hardest part of long-term monitoring is not the science. It's defending the boring re-measurement against every competing priority, every month, forever — and trusting that the tape, which never gets excited, is accumulating something no new instrument can buy after the fact: time.
No — Tidewright is a fictional company, and L-7, its tape, its quadrat counts and its seadragons are fictional. The succession sequence described, and the principle that fixed long-term quadrats are the gold standard against which remote sensing is validated, reflect real marine-monitoring practice.
Photographs are one layer of the record — L-7's quadrats are photographed every visit — but tape plus counted quadrats produces abundances, not just images. Abundance time series are what calibration against satellite and eDNA products needs, and they're robust to anything changing in camera technology across five years.
Pair counting against an experienced diver on the same quadrats until inter-observer error falls under ten per cent, then annual refreshers. The protocol card — one page — lives in the shed and on the boat. Consistency is a calibration routine, not a talent.
No — they answer different questions. Satellites and drones tell you how much canopy there is across hundreds of hectares; fixed transects tell you whether the instruments are telling the truth and why a hectare's number changed. Programs that try to skip the transect end up with beautiful maps they can't interpret.
A Tidewright field note from Maria Island, Tasmania: deploying Holdfast seed lines onto heat-struck reef at dawn, and what we found three months on.
Jack Callum ·
Ecological succession explains how a bare rocky reef rebuilds into a kelp forest — the pioneer algae, understory kelps, canopy giants, and what restoration can safely skip.
Dr. Mara Ellison ·
Join Tidewright's dive survey team as they count an advancing urchin front on Tasmania's coast — the methodical, cold, essential math of kelp restoration.
Jack Callum ·