Science8 min read
Counting Fish With Sound: Acoustic Surveys Explained
How do you count fish you can't see? Acoustic surveys use sonar to turn echoes into biomass estimates. Here's how echosounders work — and their limits.
Dr. Mara Ellison ·
Multibeam and sidescan sonar build metre-scale maps of reef relief, substrate and kelp canopy. How acoustic mapping works, and what it can and can't see.
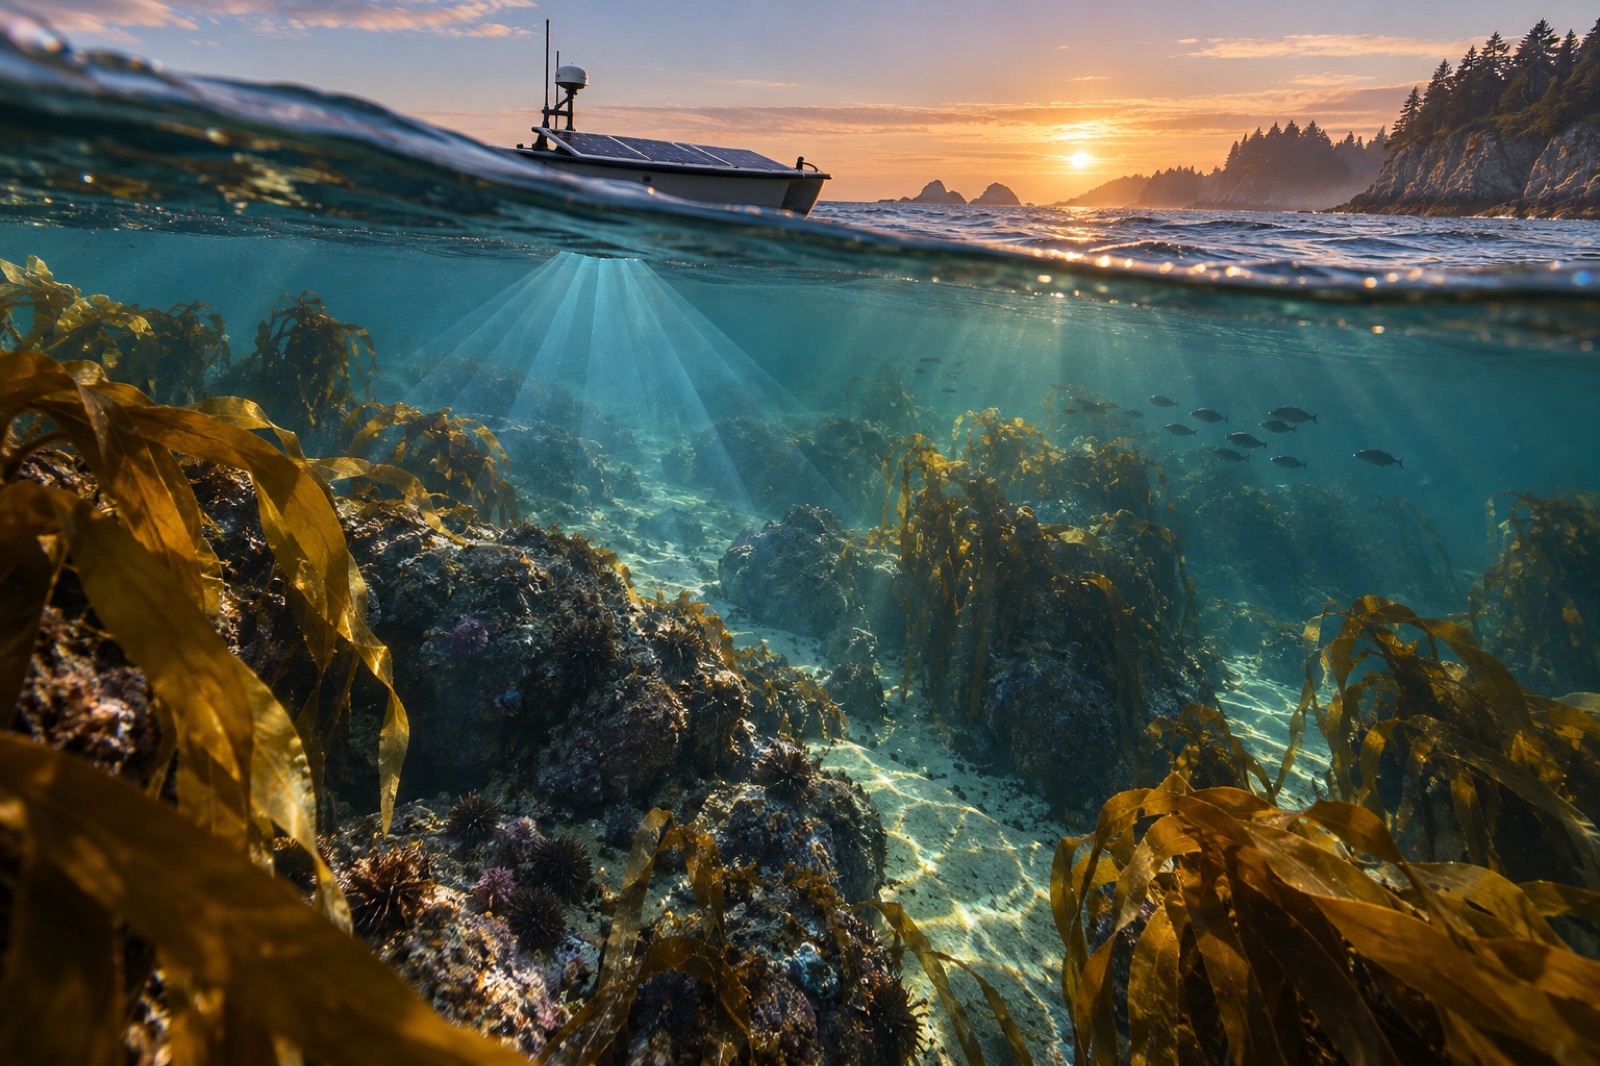
You cannot restore a forest you cannot find the floor of. Before a single seeded line touches water, a restoration team needs to answer deceptively simple questions: where is the bare rock, how rugged is it, how deep, and what is already growing there? Divers see tens of metres at a time. Satellites see only the canopy. The tool that fills the gap — that can strip the water away, in effect, and draw the reef itself — is sonar. Modern acoustic mapping can render a kelp forest's footing in metre-scale detail: every boulder field, every sand channel, every patch of rugose rock where young kelp might take hold.
Light travels poorly in seawater. Even in clear coastal water, a camera's useful range is measured in metres, and turbidity, plankton and afternoon glare shrink it further. Sound, by contrast, is the ocean's long-distance messenger — the physics of underwater acoustics means a pulse of high-frequency sound can sweep hundreds of metres and return with a precise account of what it struck.
Every sonar mapping system works on the same elemental bargain: emit a pulse, listen for the echo, and use the delay to compute distance. What varies is how the echoes are arranged — and that is where the three workhorse instruments diverge.
A multibeam echosounder (MBES) mounts on a vessel's hull or keel and fires a fan of narrow beams — modern coastal systems use 256 to 1,024 of them — across a swath of seafloor beneath and beside the ship. Each beam returns a depth; together, the swath paints a strip of bathymetry possibly 3–7 times the water depth wide. Drive a lawn-mowing pattern of parallel lines and those strips merge into a continuous digital terrain model.
Two details make multibeam data more than a depth chart:
Sidescan towfish trade vertical precision for texture. Towed near the bottom, they beam sound sideways and build a photo-like image where boulders cast acoustic shadows and outcrops glow. A skilled interpreter can read a sidescan mosaic like a morning newspaper: here the urchin-grazed pavement, there the cobble, there a wreck nobody remembered. It is the instrument of choice when the question is what the bottom is, rather than exactly how deep.
Vertical echosounders look down (or up) at a single cone of water. Cheap, rugged and littoral-workhorse simple, they measure depth under kayaks and small boats — and, importantly for kelp work, they can detect the canopy itself. A kelp stand returns a strong echo from its gas-filled floats and dense fronds, so an upward-looking sonar on a mooring can log canopy presence day after day, storm after storm, with no satellite pass required. The same principle drives acoustic fish surveys, which count schooling fish inside and around the forest edge.
Seafloor relief is only the premise of the story. Map-makers layer canopy data on top, and each source has a floor plan of trade-offs:
The standard workflow is a convergence: multibeam builds the terrain, sidescan classifies the substrate, camera drops or ROV footage labels the life, and satellites date-stamp the canopy through time. Where the layers agree, you trust the map. Where they disagree, you have found something interesting.
Acoustic maps are not academic wallpaper; they re-route real decisions.
Siting. Restoration succeeds or fails at the scale of the individual boulder. A multibeam-backed substrate map tells a crew which hectares are consolidated bedrock (can hold), which are mobile cobble (rarely worth the line), and which are sand plains beside reef edges (candidate sites for artificial reef modules, in some programs).
Baselines. Seismic-precise time series of backscatter and canopy echo tell you whether a forest is spreading, thinning or marching upslope with warming water. This is the raw material of honest monitoring — the same philosophy that drives biomass estimation from dive tapes to modelled tonnes.
A worked example. Tidewright's own vessels illustrate the pattern. Every Drifter reseeding vessel carries a survey-grade multibeam array and side-looking cameras, and runs two passes over a candidate reef: a slow mapping pass to build the terrain-and-substrate grid, then a seeding pass whose route is computed from that grid. Holdfast lines are laid only where the acoustic classification says "consolidated rock, suitable relief, canopy historically present." (Tidewright's project numbers are fictional, but the two-pass method is exactly how real engineering hydrography and habitat mapping converge.)
Sonar is not magic, and quoting it as magic is how maps mislead.
If you are a council marine officer, a fisheries biologist or a citizen-science diver handed a "reef map," the questions worth asking are simple: What year? What resolution? Was it ground-truthed? Has someone published what the backscatter classes correspond to ecologically? A bathymetry grid without those answers is a pretty picture, not an instrument.
Where those answers are solid, though, acoustic mapping is the closest thing science has to a drainage of the coastal ocean: a way to see the whole reef at once, at last, from the headland's shadow to the sand channels in between.
Detail scales with depth because acoustic beams spread. In 10–30 m, typical of kelp reefs, modern systems resolve features of tens of centimetres. Below 50 m, detail coarsens and sound-speed corrections matter more — but relief and substrate classes remain highly mappable.
Not reliably from a single echo. Gas-bladdered kelps return a strong signal, but low understory seaweeds can be acoustically invisible. Sonar establishes where structure exists; camera drops, divers or ROVs assign the biology.
Fisheries and survey sonars operate at frequencies and duty cycles considered low-risk to most fauna, and major studies have not shown population-level harm from survey systems like multibeam. Survey planners nonetheless follow environmental guidelines — and like all researchers, they trade their footprint against the information value of the map.
Satellites are superb at surface canopy area but cannot see under the canopy, under sediment plumes, or under clouds. The seafloor itself — the substrate on which restoration depends — is invisible from orbit. Acoustics is the only tool that maps it continuously.
Ground-truthing is the direct visual observation — a camera drop, a diver lap, an ROV pass — of what an acoustic signature corresponds to biologically. Without it, a backscatter mosaic is a guess with good graphics. With it, a sonar mosaic becomes a map you can build a restoration program on.
How do you count fish you can't see? Acoustic surveys use sonar to turn echoes into biomass estimates. Here's how echosounders work — and their limits.
Dr. Mara Ellison ·
From Sentinel-2 pixels to drone orthomosaics, here's how scientists detect, map and track kelp forest canopies from space — and where the limits are.
Dr. Mara Ellison ·
Underwater, sound is the only sense that travels. How sound speed works in seawater, what the SOFAR channel is, and why the ocean is far noisier than it seems.
Dr. Mara Ellison ·