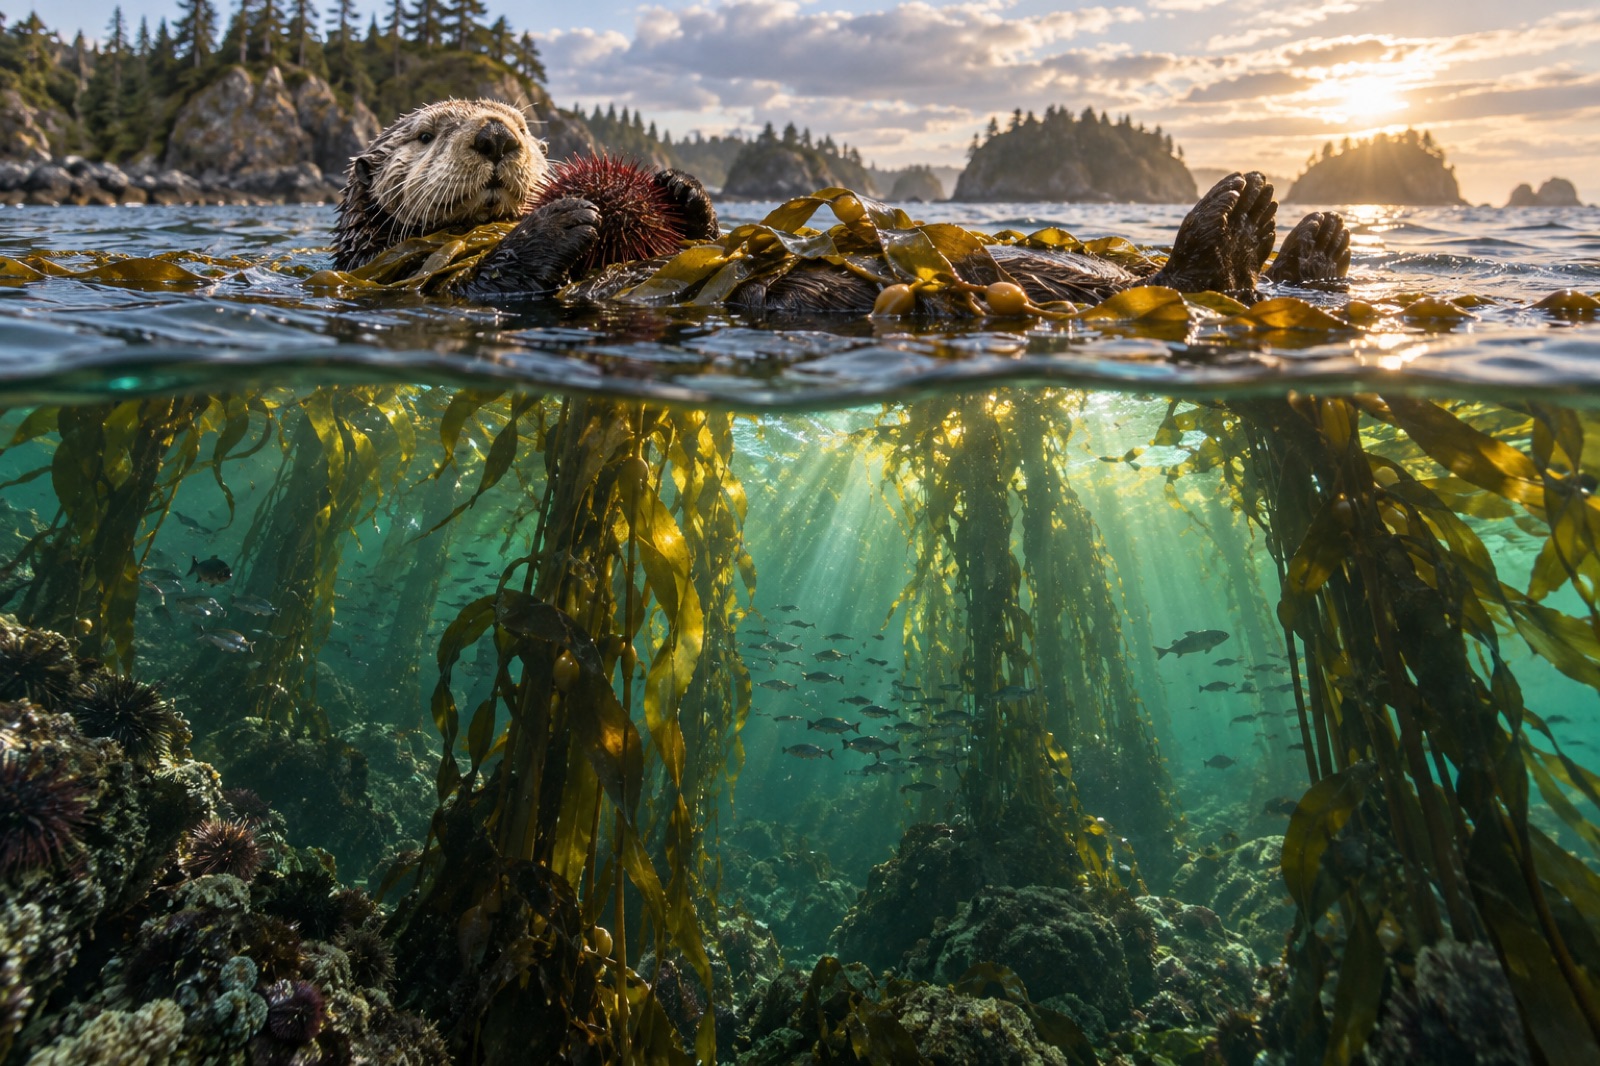
A sea otter cracks a sea urchin on its chest. The urchin grew up grazing drift kelp that tore free of the forest in last winter's storms. The kelp fixed its carbon from the water column two seasons ago. Every step of that chain left a faint chemical fingerprint — and if you sample the right tissues and run them through a mass spectrometer, you can read the whole story from the ratios of a few heavy atoms. That is the premise of stable isotope ecology, one of the workhorse methods for reconstructing who eats what in marine food webs, and for testing whether kelp carbon really moves through the reef the way food-web diagrams say it does.
Two elements, two questions
Nearly all food-web isotope work rests on two pairs of atoms:
- Carbon-12 and carbon-13 (¹²C/¹³C) — reported as δ¹³C, in parts per thousand (‰), against an international standard. Carbon isotope ratios change very little as food moves up a food chain, so δ¹³C acts chiefly as a source tracer: it tells you which primary producer ultimately fed the animal.
- Nitrogen-14 and nitrogen-15 (¹⁴N/¹⁵N) — reported as δ¹⁵N. Nitrogen ratios step upward by a fairly consistent amount at each meal, so δ¹⁵N acts as a trophic-level gauge: it tells you how high the animal feeds.
Together, one small tissue sample yields two coordinates — source on the x-axis, trophic height on the y-axis — that place a consumer on the food-web map.
Carbon: the producer's signature
Different primary producers fix carbon through different biochemical machinery, and they end up with measurably different δ¹³C values. In coastal systems the spread is large enough to be useful: kelps and other macroalgae tend to be isotopically "heavier" (less negative δ¹³C, often roughly −12 to −20‰) than offshore phytoplankton (often roughly −18 to −24‰), while seagrasses sit heavier still and terrestrial plant material entering from rivers is usually lighter. That separation is what allows a researcher to ask, of a mussel or a crab on the reef edge: did your carbon come up from the kelp forest, in from the plankton, or down from the watershed?
Crucially, carbon changes hands nearly intact. An animal's δ¹³C stays within roughly 0–1‰ of its diet's — close enough that the old field aphorism "you are what you eat, plus a per mil" still earns its keep in lectures and lab manuals.
Nitrogen: climbing the ladder
Nitrogen behaves differently. When an animal metabolises protein, the lighter isotope is preferentially excreted, leaving the consumer's tissues enriched in ¹⁵N relative to its food. The average step-up — the trophic discrimination factor — is often taken as roughly 3–4‰ per trophic level in aquatic systems. Baseline herbivore at +8‰? A predator eating it will tend to land near +11–12‰; a top predator above that, near +14–15‰.
That regularity lets ecologists estimate trophic position quantitatively rather than by guesswork, compare the effective food-chain length of different reefs, and spot omnivores that feed across levels — their δ¹⁵N lands between the rungs.
From a biopsy punch to a food-web map
A modern isotope food-web study is a structured chain of decisions, and the quality of the answer is set long before the mass spectrometer warms up.
1. Sampling across the web. Researchers collect the candidate basal sources (kelp blades, plankton tows, detritus, particulate organic matter) plus consumers spanning the suspected levels: grazers like urchins and abalone, small predators, and top carnivores. Tissue choice matters — more on that below.
2. Preparation. Samples are dried, ground, and often treated to remove lipids and carbonates, both of which distort isotope ratios (lipids are isotopically light; shell carbonate contaminates δ¹³C). Then milligram quantities are tin-capsuled and combusted.
3. Measurement. An isotope ratio mass spectrometer counts ¹³C and ¹⁵N against the light isotopes and reports δ values with precision far finer than the ecological variation being studied.
4. Mixing models. Because consumers blend multiple sources, raw δ values underdetermine the diet. Bayesian mixing models (MixSIAR and its predecessors, plus community-metrics tools like SIBER) take the source signatures, apply discrimination-factor distributions, and return proportional diet estimates with credible intervals — for example, that a reef fish's carbon was perhaps 40–70% kelp-derived. The honest output is a range, not a point.
5. Interpretation against ecology. Isotopes integrate diet over time, so a value must be read alongside gut contents, behavioural observation and — increasingly — complementary tracers like environmental DNA, which answers the related question of who is present rather than who fed whom.
What isotopes have revealed in kelp forests
Decades of isotope work on temperate reefs have overturned a classroom simplification. Textbook diagrams long showed herbivores browsing living kelp directly, but isotope mixing models repeatedly implicate detrital pathways: a large share of kelp carbon enters food webs after the blade tears free, fragments, and is colonised by microbes, as explored in our piece on the detritus pathways of kelp forests. Filter feeders metres to kilometres away, deposit feeders working the sediment, and even fishes that never touch a blade can carry a dominant kelp-carbon signature.
Isotopes have also mapped trophic cascades in chemical terms. On reefs where sea otters suppress urchins — the cascade described in our trophic cascade explainer — urchin tissues show diets shifted toward drift algae and away from active grazing, and predator tissue signatures track the reorganised web. And along the coast-to-deep gradient, the same logic those studies use underpins attempts to detect kelp carbon exported offshore: if kelp-derived material genuinely reaches deep sediments and feeds deep communities, its carbon signature should survive the trip. Our companion article on following kelp carbon through the food web takes up that export question directly.
The fine print: where isotope ecology goes wrong
The method is powerful precisely because it is simple, and dangerous for the same reason. Serious practitioners treat these as standing warnings:
- Discrimination factors are estimates, not constants. The ~3.4‰ nitrogen step varies with diet quality, taxon and tissue. Using a textbook value where a species-specific one exists can shift estimated trophic position by half a level.
- Tissues have memories of different lengths. Blood plasma turns over in days to weeks; muscle integrates months; liver sits between; collagen in bone or whale baleen archives years. A fin clip tells you about last season, not last week — useful, but you must know which clock you sampled.
- Baselines drift. δ¹⁵N at the base of the web varies with nitrate source and local nitrogen cycling — which differs with upwelling strength, season and geography. Comparing "trophic level" between two reefs without a shared baseline organism is comparing altitudes from different sea levels.
- Isotopes can't distinguish what they can't distinguish. Two sources with overlapping signatures (say, kelp and a red alga) are mathematically indistinguishable to δ¹³C/δ¹⁵N alone; adding δ³⁴S (sulfur helps separate benthic from pelagic production) or fatty-acid and compound-specific isotope analyses is the standard escape.
- Starving and growing animals break the rules. Fasting can elevate δ¹⁵N as the body recycles its own protein, mimicking a rise in trophic level; rapid growth dilutes signals. Physiology writes footnotes into the data.
Isotopes in restoration monitoring
For restoration science, isotopes answer the question monitoring programs most want answered: is the rebuilt forest actually feeding the reef? Canopy area from satellite and drone mapping shows a forest standing; isotope fingerprints in local filter feeders, fishes and scavengers show its carbon circulating. Before-and-after sampling of a restored site against a reference reef can track the rebuilt web's recovery — not just structure, but function.
At Tidewright, isotope panels run alongside eDNA and visual surveys in the verification layer of Canopy Ledger are part of our (fictional) monitoring program — but the analytical machinery described here is entirely real, standard practice in marine ecology laboratories worldwide.
Key takeaways
- δ¹³C traces where carbon came from (kelp vs plankton vs terrestrial); δ¹⁵N traces how high a consumer feeds, stepping up roughly 3–4‰ per trophic level.
- Bayesian mixing models convert isotope values into proportional diet estimates — always with uncertainty ranges, never single contestable numbers.
- Isotope studies reveal that much kelp-carbon flow runs through detrital pathways, reaching animals that never graze a living blade.
- Tissue choice sets the time window: days for plasma, months for muscle, years for collagen — sample design is interpretation.
- Common failure modes include generic discrimination factors, missing baselines between reefs, and overlapping source signatures.
- For restoration, isotopes test functional recovery — whether a rebuilt forest's carbon is genuinely moving through the food web.
FAQ
What does the "δ" in δ¹³C mean?
Delta notation expresses the ratio of heavy to light isotope in a sample relative to an international standard, in parts per thousand (‰). δ¹³C = ((¹³C/¹²C)sample ÷ (¹³C/¹²C)standard − 1) × 1000. Negative values mean the sample is "lighter" than the standard; the scale makes tiny natural differences easy to compare.
Can isotopes tell us exactly what an animal ate?
Not item by item. Isotopes report the blended, assimilated diet over the tissue's turnover window, resolved into contributions from isotopically distinct source groups. They complement — not replace — gut-content analysis, DNA metabarcoding of stomach contents, and direct observation.
Why add sulfur (δ³⁴S) to a study?
Sulfur isotopes separate benthic and detrital pathways from pelagic ones in many coastal systems, adding a third axis when carbon and nitrogen alone can't tell candidate sources apart. Sulfur undergoes little trophic fractionation, so like carbon it behaves mainly as a source tracer.
Do isotope studies require harming animals?
Usually no. Ecologists routinely use non-lethal samples: fin clips from fish, biopsy darts on mammals, feather or blood samples from seabirds, foot tissue from molluscs. Many baseline sources (kelp blades, plankton, detritus) are simply collected.
How do isotopes relate to blue carbon accounting?
Isotope forensics can test whether kelp-derived carbon shows up in consumers or sediments offshore — evidence relevant to claims about where kelp carbon ends up. A detection is not itself a carbon credit, but it grounds export hypotheses in measurements rather than models alone.