Science11 min read
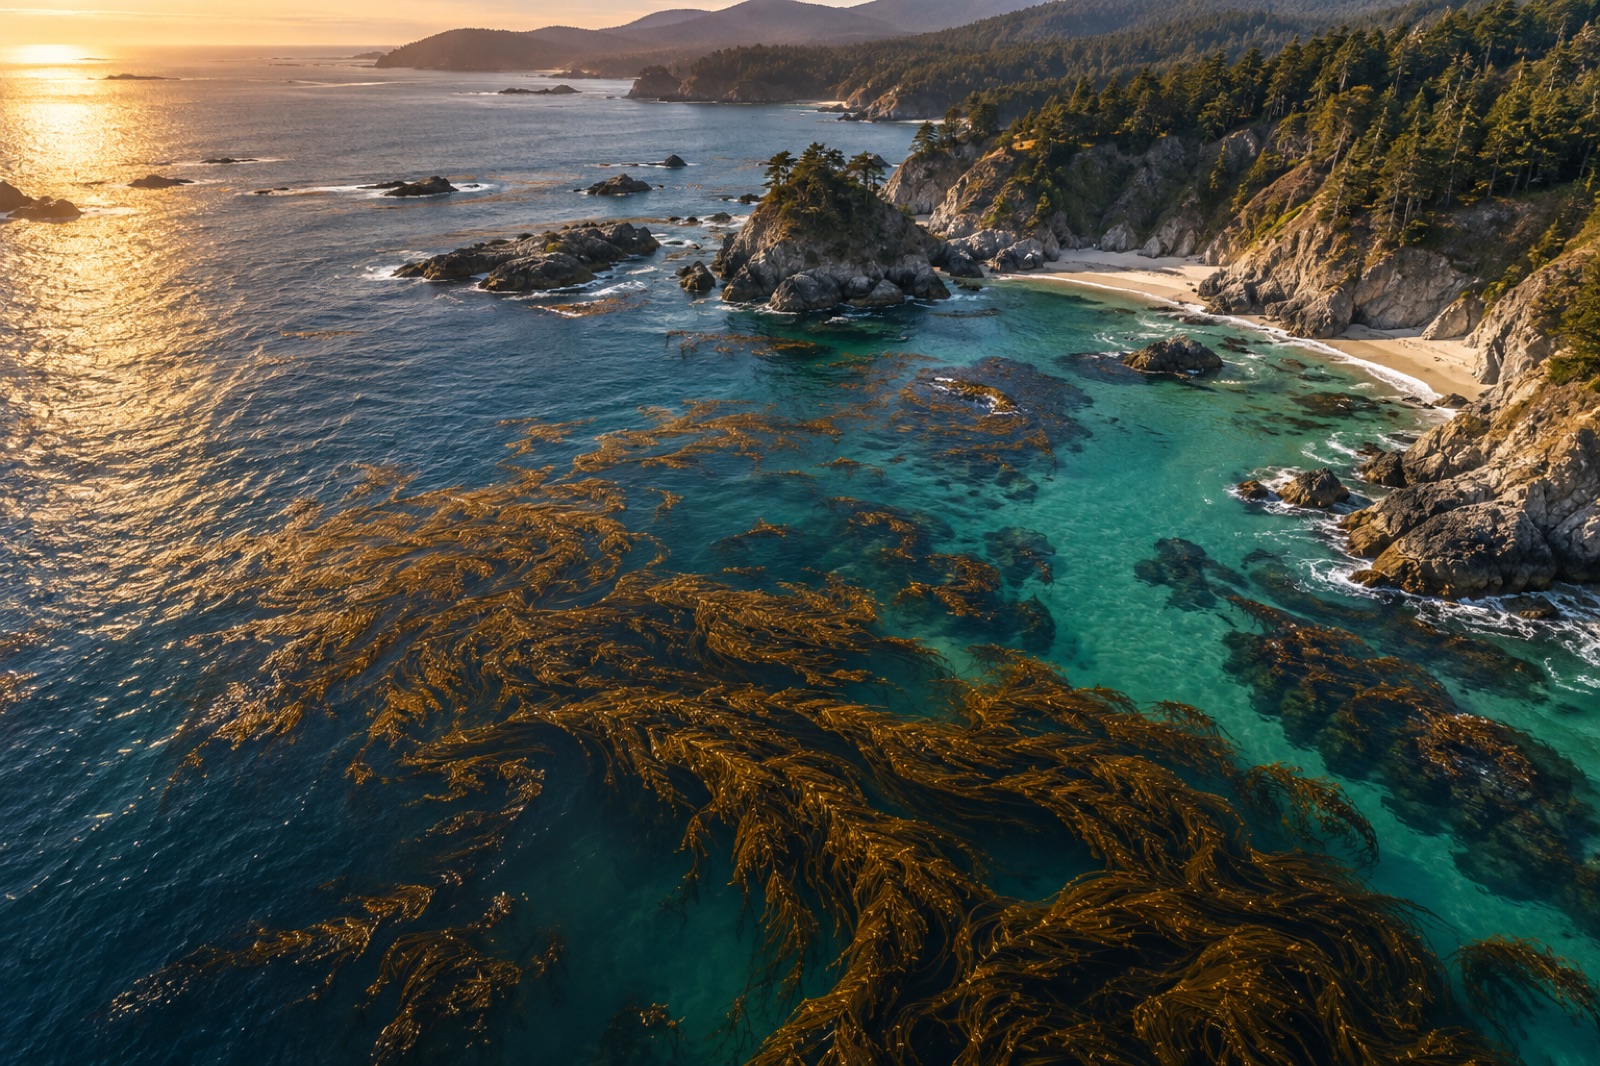
How Satellites See Kelp: Remote Sensing of Coastal Canopies
From Sentinel-2 pixels to drone orthomosaics, here's how scientists detect, map and track kelp forest canopies from space — and where the limits are.
Dr. Mara Ellison ·
Why the sea turns green, turquoise or milky — and how ocean-colour satellites read chlorophyll from orbit to map blooms, currents and ocean life.
Fly over the coast in a small plane and the sea stops being blue and becomes a painting: bottle-green swirls along a headland, a chalky turquoise plume off an estuary, milky bands offshore where the chart says nothing but water. Every one of those colours is information. Phytoplankton — the tiny drifting algae that power almost all marine life — tint seawater with their pigments, and sediments, dissolved organic matter and light-scattering shells add their own signatures. Since the late 1970s, satellites have been reading those tints systematically, turning the colour of the ocean into one of the longest, most complete environmental records humanity owns. Ocean colour is how we watch a trillion microscopic organisms breathe, bloom and die — and it is the first place a warming, changing ocean shows the shift.
This is the companion layer to the satellite maps of kelp canopies we build on the coast: kelp mapping reads the forest itself, while ocean colour reads the plankton soup the forest swims in.
Pure seawater absorbs red light strongly and scatters blue, which is why the deep open ocean reads as a saturated navy. Any colour shift from that baseline is caused by something in the water:
Oceanographers divide the sea by optical cause. Case 1 waters — most of the open ocean — have their colour set almost entirely by phytoplankton and their decay products, so chlorophyll algorithms work beautifully. Case 2 waters — most coasts — mix pigments with sediment and CDOM from land, demanding more complex band-mixing algorithms. The kelp coasts we care most about are stubbornly, gloriously Case 2.
An ocean-colour sensor is a radiometer that measures the spectrum of sunlight leaving the sea surface, pixel by pixel, in narrow visible and near-infrared bands. The challenge is brutal: roughly nine tenths of the light reaching the satellite is scattered from the atmosphere and never touched the ocean. The first step in any ocean-colour processing chain is atmospheric correction — modelling and subtracting aerosol and molecular scattering until only the water-leaving radiance remains. Errors of a few percent in that correction can swamp the biological signal, which is why ocean colour is among the most demanding measurements in Earth observation.
From the corrected spectrum, algorithms estimate chlorophyll-a concentration using the ratio of reflectance in blue and green bands: chlorophyll-rich water absorbs more blue, so a falling blue-to-green ratio means more plankton. Newer processing approaches also derive:
The modern record began with the Coastal Zone Color Scanner in 1978–1986, a proof of concept ahead of its time. The continuous modern era opened with the SeaWiFS mission (1997–2010), followed by the MODIS instruments on the Terra and Aqua satellites (2000 and 2002 onward), the VIIRS sensors on the Suomi NPP and NOAA polar orbiters (2011 onward), and the European OLCI instruments on Sentinel-3 (2016 onward). The newest generation — exemplified by NASA's PACE mission, launched in 2024 — is hyperspectral, measuring hundreds of narrow bands instead of a handful, resolving pigment groups well enough to begin distinguishing phytoplankton types from orbit rather than merely counting chlorophyll.
Each pixel of these global imagers covers roughly 300 metres to 1 kilometre of ocean, and together the constellation images essentially the entire ice-free ocean every one to two days, clouds permitting.
Turn colour records into time series and the ocean's pulse emerges.
Temperate seas bloom in spring, when lengthening days stabilise the upper water column while winter nutrients still linger near the surface. Polar seas bloom explosively in the brief summer light. Western boundary current regions show filaments of green wherever upwelling lifts deep, nutrient-rich water into the sun. The planet's chlorophyll map is, in effect, a real-time map of where nutrients meet light — the fundamental equation of ocean fertility.
Ocean colour caught evidence of shifting bloom timing as the ocean warmed, tracked how marine heatwaves starve surface waters of nutrients by tightening stratification, and documents the northward creep of warm-water plankton communities. Research published in the last few years suggests the low-latitude ocean's blue-green hue is measurably shifting as productivity patterns change — one of the first biological fingerprints of climate change visible from orbit.
Harmful algal blooms announce themselves in colour imagery, letting shellfish managers close harvests before toxins accumulate. Fisheries agencies use chlorophyll fronts — the sharp green-to-blue edges along currents — to locate feeding habitat. Search-and-rescue and oil-spill responders read surface convergence lines the same way. And because phytoplankton take up carbon dioxide as they grow, chlorophyll maps feed the primary-production models behind our understanding of the ocean's biological carbon pump — the slow rain of marine snow that carries carbon to the deep sea.
A kelp forest's fate is written partly in its water. The same Case 2 complexity that makes coastal chlorophyll hard to measure also describes the conditions forests live in:
At Tidewright, our Canopy Ledger monitoring stack pairs canopy-mapping satellites with ocean-colour products, in-water sensors and autonomous vehicles like Argo floats — orbit for the wide view, instruments in the water for the ground truth. The same pairing underpins open coastal datasets in our open data catalogue.
Three cautions apply to every chlorophyll map. First, clouds: pixels under cloud are simply missing, and coastal cloudiness biases long-term averages. Second, depth: the signal integrates only the upper well-lit layer, missing deep chlorophyll maxima that in-situ profiles reveal. Third, the Case 2 problem: on sediment-rich coasts, a "chlorophyll" pixel may be half mud. Ocean colour is therefore discovery and context, always anchored by instruments that swim — profilers, gliders and moored sensors — which is why modern oceanography treats satellites and profiling floats as one observing system rather than two.
Blue water is nearly empty: little plankton, little sediment, light absorbed cleanly. Green water holds enough phytoplankton chlorophyll to change the blue-to-green reflectance ratio — the sea is literally showing you its standing crop of microscopic algae.
Traditional broad-band sensors estimate total chlorophyll. New hyperspectral missions (e.g. PACE) resolve finer pigment signatures and can begin separating major plankton groups — diatom-rich communities versus coccolithophore blooms, for instance — though species-level identification still requires samples.
A proof-of-concept sensor flew 1978–1986, and a continuous, high-quality global record runs from SeaWiFS in 1997 to today's MODIS, VIIRS, OLCI and PACE constellation — nearly three decades of daily global observations.
Coastal (Case 2) water contains sediment and dissolved organic matter from land that also absorb or scatter blue light, mimicking chlorophyll. Specialised algorithms help, but coastal products carry larger uncertainties and need validation against boat measurements.
Water colour expresses the nutrient pulses, sediment plumes and clarity that govern kelp growth and survival. Restorers use colour time series to time planting, assess flood damage and choose resilient sites — always combined with kelp-canopy mapping and in-water sensors.
From Sentinel-2 pixels to drone orthomosaics, here's how scientists detect, map and track kelp forest canopies from space — and where the limits are.
Dr. Mara Ellison ·
A deep dive into upwelling physics: Ekman transport, the world's great upwelling systems, how scientists track them from space, and what climate change does.
Dr. Lena Fischer ·
Nearly 4,000 drifting robots take the ocean's temperature from within. How Argo profiling floats work, what they measure, and why the data is free.
Dr. Lena Fischer ·