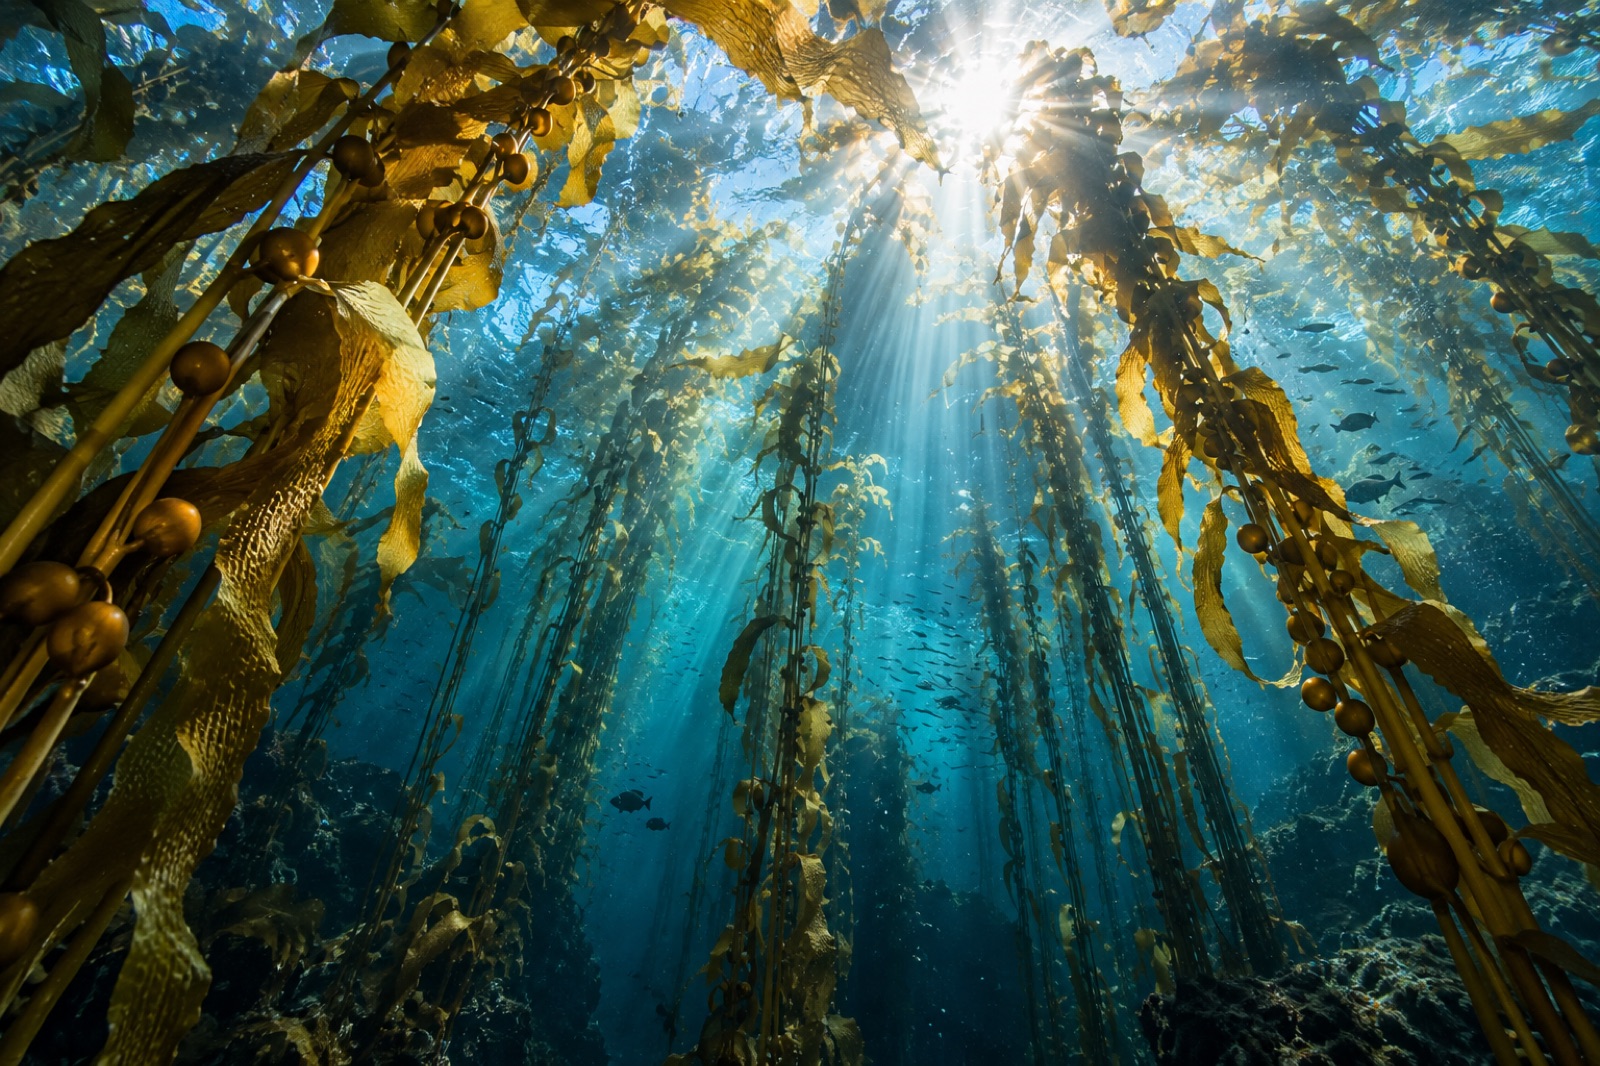
Everything a kelp forest does — feeding abalone, sheltering rockfish, damping waves, exporting carbon to the deep sea — is paid for by one transaction: kelp turning sunlight and dissolved inorganic carbon into new tissue. Ecologists call that primary production, and kelp forests are among the most productive ecosystems ever measured, with published stand-level estimates in the range of roughly 1,000 to more than 3,000 grams of carbon per square metre per year — squarely in the league of the most fertile tropical forests and many times richer than the open ocean around them.
This article explains what that number means, how a plant-like alga stretching tens of metres from rock to surface produces it, how scientists actually measure production underwater, what throttles it, and where the bounty ends up. (For the chemistry of the photosynthesis itself, see How Kelp Photosynthesizes; here we are interested in the rate and the accounting.)
GPP, NPP and the currency of growth
Production talk uses a small set of terms worth pinning down:
- Gross primary production (GPP) — the total carbon fixed by photosynthesis per unit area per unit time.
- Respiration — the portion the kelp burns just to stay alive, which is considerable in warm water.
- Net primary production (NPP) — GPP minus respiration: the carbon actually available to build blade, stipe and holdfast, to be eaten, or to drift away. When someone cites a kelp forest's productivity, they almost always mean NPP.
Units matter too. Carbon-per-area-per-year (g C m⁻² yr⁻¹) is the standard for comparing ecosystems. Growth-in-length (centimetres per day) is what divers measure on individual fronds, and biomass turnover time (how long the standing crop takes to replace itself) is the third common lens. A forest can hold modest standing biomass while sustaining enormous production — because it is constantly being cropped, shredded by storms, and renewed.
Just how fast is fast?
The giant kelp, Macrocystis pyrifera, holds the headline records: under good light and nitrate, individual fronds off California have been clocked elongating in the region of 25–40 centimetres per day over sustained periods, with exceptional bursts reported higher still. The growing tip is not thickening like a tree ring; it is a conveyor of blade tissue streaming upward from a basal meristem, shedding senescent tissue at the frond tip as it adds new at the base. The result is a forest that can rebuild a summer canopy after a winter storm in a matter of weeks.
Other canopy formers run different strategies. Bull kelp is annual — an entire adult canopy built in one growing season. Golden kelp and the Laminarian forests of the North Atlantic grow more slowly but live for years, accumulating production like capital rather than wages. When researchers total a whole bed — canopy, understory, turf and the productive crusts beneath — kelp-dominated reefs consistently rank at or near the top of marine NPP tables, far above phytoplankton-driven production in the water over them on a per-area basis.
The honest caveat: production is intensely local. A sunlit, nitrate-flushed kelp bed at ten metres depth is a different economic theatre from a kelp bed at thirty metres under turbid summer outflow; published ranges span years and sites widely, and anyone quoting a single figure for "kelp production" is smoothing over real and policy-relevant variability.
How do you measure the ocean's garden?
Four families of methods dominate, each with its own bias.
1. Marked fronds and hole-punch growth
The oldest and still indispensable technique: divers tag individual fronds, punch small holes at a measured distance from the meristem, and return days to weeks later. The hole's migration toward the tip gives tissue production directly; summed across fronds and scaled by density, it yields stand-level NPP. Slow, beautiful, labour-intensive — and accurate. This is how the classic California bed estimates were built.
2. Biomass harvest and allometry
Cut quadrats, weigh everything, build the regression between easily measured traits (stipe count, holdfast diameter, canopy area) and wet mass. Combined with repeated canopy surveys, the change in standing biomass plus known losses approximates production. Our explainer on measuring kelp biomass covers the diver-to-tonne pipeline in detail.
3. Oxygen and eddy covariance
Here the measurement happens in the water itself. Photosynthesis releases oxygen; respiration consumes it. Aquatic eddy covariance systems — fast oxygen sensors paired with 3D current meters — watch the oxygen flicker as water parcels pass over the reef, integrating photosynthesis and respiration for the whole patch, day and night, without touching a single plant. The method captures the whole community — kelp, turf, phytoplankton, bacteria — and reveals the large nighttime respiration signal that tagged-frond work never sees.
4. Satellites and drones, calibrated from below
Giant kelp canopy area is visible from space, and multi-decade satellite records now exist for entire coastlines (see How Satellites See Kelp). Canopy area alone is not production — a sparse canopy over a thin bed photographs the same as a lush one — so the modern approach blends remote canopy data with diver-calibrated biomass relationships and ocean-colour estimates of light and nutrients, tuned site by site. This is exactly the integration problem Tidewright's Canopy Ledger platform is built around: satellite and drone canopy mapping, ground-truthed by survey, feeding production models that managers can actually use.
What sets the throttle
Production on a reef is capped by the harshest of several limits:
- Light. Depth and water clarity set the photon budget; most canopy kelp production happens in the sunlit upper water column (the euphotic zone). Turbid plumes and dark winters cut hard.
- Nitrogen. In most temperate systems, nitrate is the binding constraint, and its supply is tied to upwelling, internal waves and winter mixing — which is why production rides the same boundary-current machinery that decides where kelp grows at all.
- Temperature. Warm water raises respiration faster than photosynthesis and suppresses nitrate supply; production craters in marine-heatwave summers even where the canopy still looks intact from above.
- Grazing and storms. Urchins, kelp-cropper fish and winter swell remove tissue continuously. Production numbers implicitly include what was eaten or torn away before anyone measured it — turnover, not just what is standing.
Where all that production goes
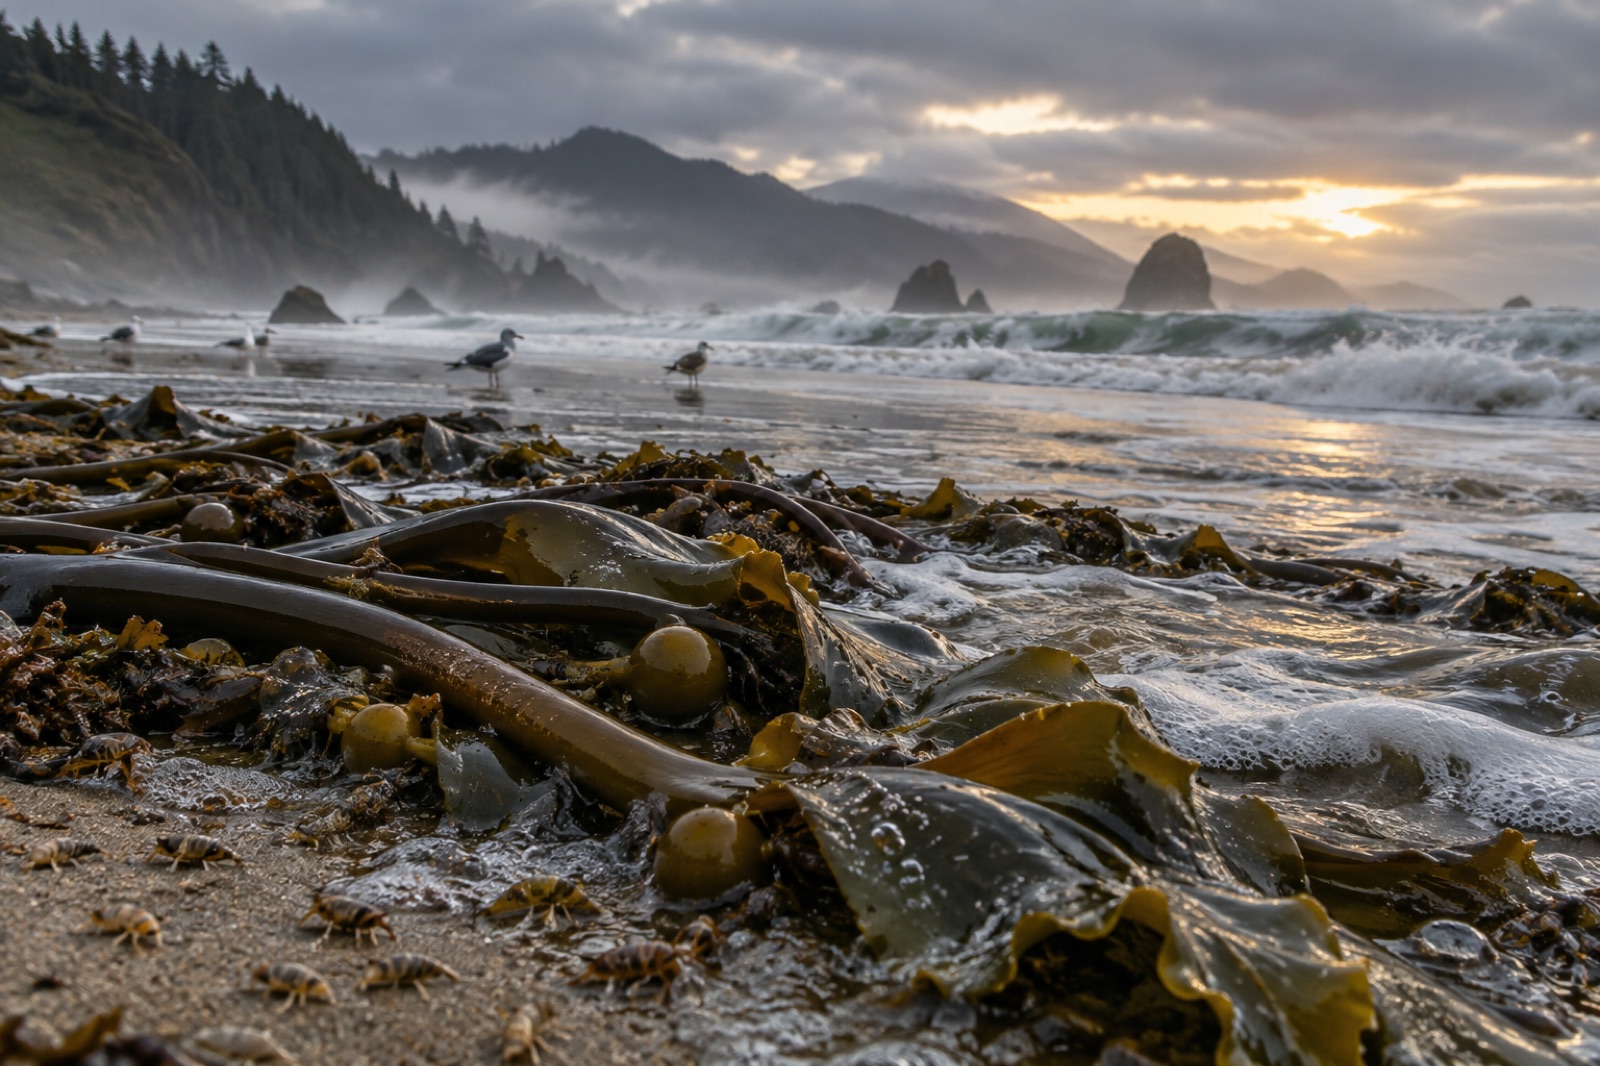
A kelp forest is famously reluctant to be grazed directly — a large share of production never passes through a living grazer. Instead it fragments: blades erode at their tips, storms rip whole plants free, and particulate and dissolved kelp carbon leaks seaward. That detrital stream feeds filter feeders on the reef edge, subsidises sandy-beach communities worlds away, and — in the fraction that reaches depth or burial — feeds the long carbon stories told in Where Kelp Carbon Goes and How Kelp Stores Carbon. Production is the headwaters of all of it: no new tissue, no export; no export, no claim on the forest's planetary significance.
Key takeaways
- Primary production is the carbon-fixing engine of the kelp forest; published stand-level NPP estimates (∼1,000–3,000+ g C m⁻² yr⁻¹) put kelp forests among Earth's most productive ecosystems per unit area.
- Giant kelp fronds can elongate 25–40 cm per day in good conditions, and whole canopies regrow within weeks after storms; standing biomass understates production because turnover is constant.
- Scientists measure production with tagged fronds, harvested quadrats and allometry, oxygen eddy-covariance over the reef, and satellite-drone canopy records calibrated from below.
- Light and nitrate set most of the throttle; warm water suppresses production well before a canopy visibly dies.
- Most kelp production is not grazed directly but exported as detritus — the headwaters of coastal food webs and the ocean's blue-carbon debates.
FAQ
Is kelp forest production really comparable to a tropical rainforest's?
On a per-square-metre basis, yes — the best-measured kelp stands overlap the range reported for tropical forests, and they do it without soil or roots. Rainforests win by area — they cover vastly more of the planet — but per hectare, a sunlit kelp bed is one of the fastest gardens on Earth.
Why do production numbers vary so much between studies?
Because the methods see different things. Tagged fronds measure kelp-only tissue production; eddy covariance nets the whole community's photosynthesis minus respiration; remote sensing infers from canopy area using locally calibrated relationships. Depth, exposure, nutrient regime and the year chosen all move the answer by large factors.
Does faster production mean faster carbon sequestration?
Not automatically. Production is gross capture; sequestration is only the fraction exported and isolated from the atmosphere for long timescales — in deep-sea sediments, for example. Most fixed kelp carbon eventually respires back. Our honest accounting of kelp carbon walks through the difference in detail.
How is Tidewright using production measurements?
At our project sites, diver-swum growth transects and drone canopy maps feed the production models behind our impact dashboard — all Tidewright figures reported there are illustrative, but the measurement architecture (tagging, remote sensing, eddy covariance calibration) mirrors the published methods described here.
Per unit of farmed area, well-run farms with optimised seedstock and no grazer pressure can match or exceed wild-bed production — but only over their footprint, which is tiny next to wild forests. Farming's role is replacing and funding restoration, not substituting for the millions of hectares of wild canopy that run planet-scale production.